时间图
时间图视觉对象是一种折线图。 查询的第一列是 x 轴,应是日期/时间。 其他数值列是 y 轴。 一个字符串列的值用于对数值列进行分组,并在图表中创建不同的线条。 其他字符串列将被忽略。 时间图视觉对象类似于折线图,只不过 x 轴始终是时间。
注意
此可视化效果只能在 render 运算符的上下文中使用。
语法
T | render timechart [with (propertyName = propertyValue [, ...])]
详细了解语法约定。
参数
| 客户 | 类型 | 必需 | 说明 |
|---|---|---|---|
| T | string |
✔️ | 输入表名称。 |
| propertyName, propertyValue | string |
键值属性对的逗号分隔列表。 请参阅支持的属性。 |
支持的属性
所有属性都是可选的。
| PropertyName | PropertyValue |
|---|---|
accumulate |
是否将每个度量的值加到其所有前导度量中(true 或 false)。 |
legend |
是否显示图例(visible 或 hidden)。 |
series |
以逗号分隔的列列表,其中的每记录值组合定义了记录所属的系列。 |
ymin |
要在 Y 轴上显示的最小值。 |
ymax |
要在 Y 轴上显示的最大值。 |
title |
可视化效果的标题(string 类型)。 |
xaxis |
如何缩放 x 轴(linear 或 log)。 |
xcolumn |
结果中的哪一列用于 x 轴。 |
xtitle |
x 轴的标题(string 类型)。 |
yaxis |
如何缩放 y 轴(linear 或 log)。 |
ycolumns |
由逗号分隔的列列表,其中包含根据 x 列的值提供的值。 |
ysplit |
如何拆分多个可视化效果。 有关详细信息,请参阅 ysplit property。 |
ytitle |
y 轴的标题(string 类型)。 |
ysplit 属性
此可视化效果支持拆分为多个 y 轴值:
ysplit |
描述 |
|---|---|
none |
为所有系列数据显示单个 y 轴。 (默认值) |
axes |
单个图表将显示多个 y 轴(每个系列一个)。 |
panels |
为每个 ycolumn 值呈现一个图表(直至达到某个限制)。 |
示例
呈现时间图
下面的示例呈现了一个标题为“Web 应用, 一个月内的流量,分解”的时间图,将数据分解为基线、季节性、趋势和残差分量。
let min_t = datetime(2017-01-05);
let max_t = datetime(2017-02-03 22:00);
let dt = 2h;
demo_make_series2
| make-series num=avg(num) on TimeStamp from min_t to max_t step dt by sid
| where sid == 'TS1'   //  select a single time series for a cleaner visualization
| extend (baseline, seasonal, trend, residual) = series_decompose(num, -1, 'linefit')  //  decomposition of a set of time series to seasonal, trend, residual, and baseline (seasonal+trend)
| render timechart with(title='Web app. traffic over a month, decomposition')
标记时间图
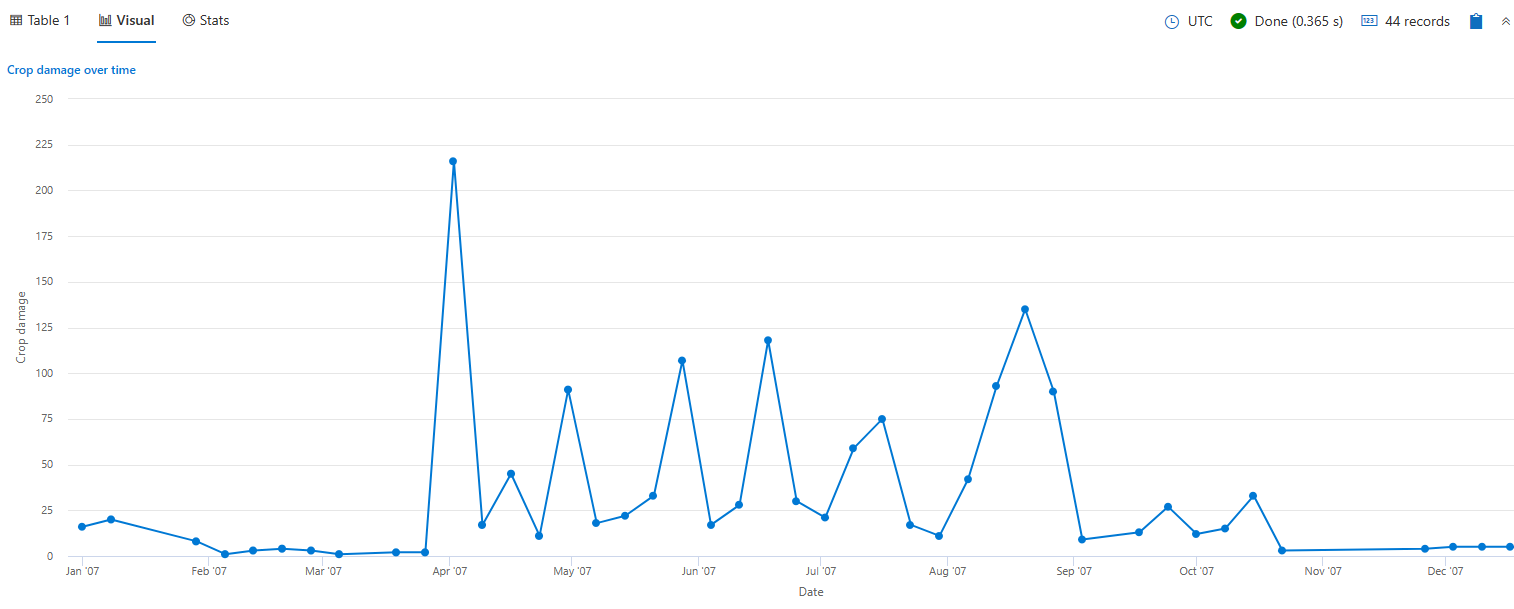
下面的示例呈现了一个描述按周分组的农作物损害的时间图。 时间图的 x 轴被标记为“日期”,y 轴被标记为“农作物损害”。
StormEvents
| where StartTime between (datetime(2007-01-01) .. datetime(2007-12-31))
    and DamageCrops > 0
| summarize EventCount = count() by bin(StartTime, 7d)
| render timechart
    with (
    title="Crop damage over time",
    xtitle="Date",
    ytitle="Crop damage",
    legend=hidden
    )
查看多个 y 轴
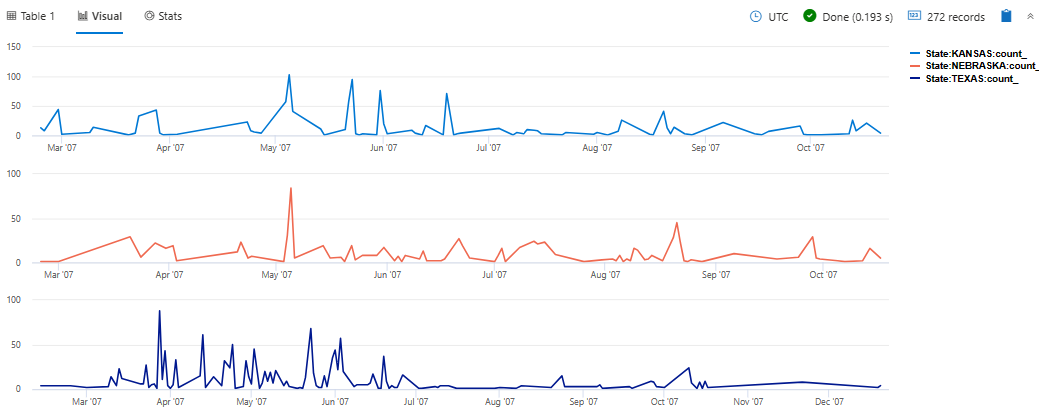
下面的示例呈现了在得克萨斯州、内布拉斯加州和堪萨斯州发生的每日冰雹事件。 可视化效果使用 ysplit 属性以单独的面板呈现每个州的事件,以便进行比较。
StormEvents
| where State in ("TEXAS", "NEBRASKA", "KANSAS") and EventType == "Hail"
| summarize count() by State, bin(StartTime, 1d)
| render timechart with (ysplit=panels)
相关内容
支持的属性
所有属性都是可选的。
| PropertyName | PropertyValue |
|---|---|
series |
以逗号分隔的列列表,其中的每记录值组合定义了记录所属的系列。 |
title |
可视化效果的标题(string 类型)。 |
示例
下面的示例呈现了一个标题为“Web 应用, 一个月内的流量,分解”的时间图,将数据分解为基线、季节性、趋势和残差分量。
let min_t = datetime(2017-01-05);
let max_t = datetime(2017-02-03 22:00);
let dt = 2h;
demo_make_series2
| make-series num=avg(num) on TimeStamp from min_t to max_t step dt by sid
| where sid == 'TS1'   //  select a single time series for a cleaner visualization
| extend (baseline, seasonal, trend, residual) = series_decompose(num, -1, 'linefit')  //  decomposition of a set of time series to seasonal, trend, residual, and baseline (seasonal+trend)
| render timechart with(title='Web app. traffic of a month, decomposition')


