Note
Access to this page requires authorization. You can try signing in or changing directories.
Access to this page requires authorization. You can try changing directories.
Understanding how to monitor file share performance is critical to ensuring that your application is running as efficiently as possible. This article shows you how to use Azure Monitor to analyze Azure Files metrics such as availability, latency, and utilization.
See Monitor Azure Files for details on the monitoring data you can collect for Azure Files and how to use it.
Applies to
| Management model | Billing model | Media tier | Redundancy | SMB | NFS |
|---|---|---|---|---|---|
| Microsoft.Storage | Provisioned v1 | SSD (premium) | Local (LRS) | ||
| Microsoft.Storage | Provisioned v1 | SSD (premium) | Zone (ZRS) | ||
| Microsoft.Storage | Pay-as-you-go | HDD (standard) | Local (LRS) | ||
| Microsoft.Storage | Pay-as-you-go | HDD (standard) | Zone (ZRS) | ||
| Microsoft.Storage | Pay-as-you-go | HDD (standard) | Geo (GRS) | ||
| Microsoft.Storage | Pay-as-you-go | HDD (standard) | GeoZone (GZRS) |
Supported metrics
Metrics for Azure Files are in these namespaces:
- Microsoft.Storage/storageAccounts
- Microsoft.Storage/storageAccounts/fileServices
For a list of available metrics for Azure Files, see Azure Files monitoring data reference.
For a list of all Azure Monitor supported metrics, which includes Azure Files, see Azure Monitor supported metrics.
View Azure Files metrics data
You can view Azure Files metrics by using the Azure portal, PowerShell, Azure CLI, or .NET.
You can analyze metrics for Azure Storage with metrics from other Azure services by using Azure Monitor Metrics Explorer. Open metrics explorer by choosing Metrics from the Azure Monitor menu. For details on using this tool, see Analyze metrics with Azure Monitor metrics explorer.
For metrics that support dimensions, you can filter the metric with the desired dimension value. For a complete list of the dimensions that Azure Storage supports, see Metrics dimensions.
Monitor workload performance
You can use Azure Monitor to analyze workloads that utilize Azure Files. Follow these steps.
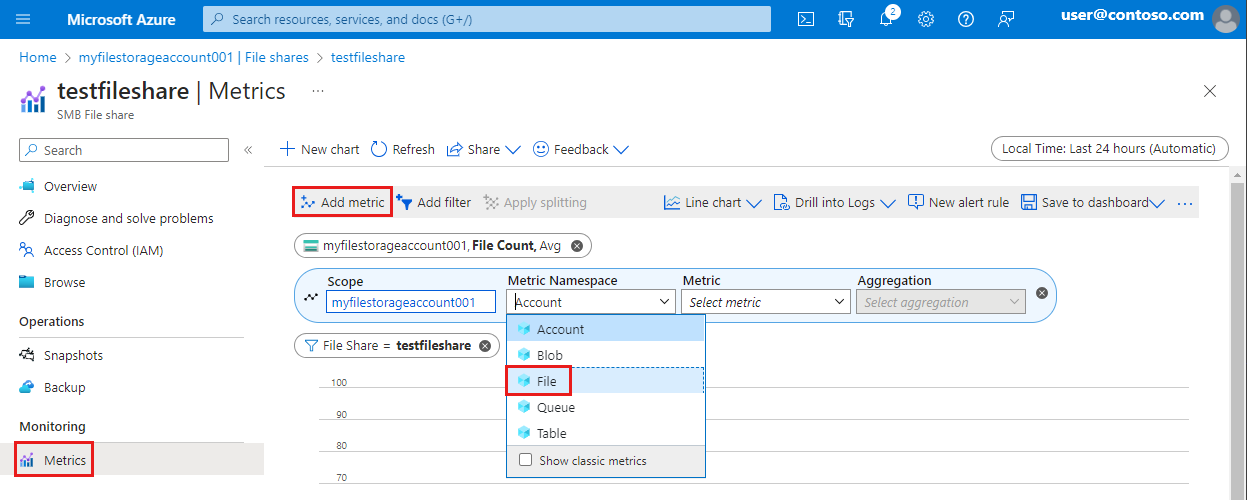
- Navigate to your storage account in the Azure portal.
- In the service menu, under Monitoring, select Metrics.
- Under Metric namespace, select File.
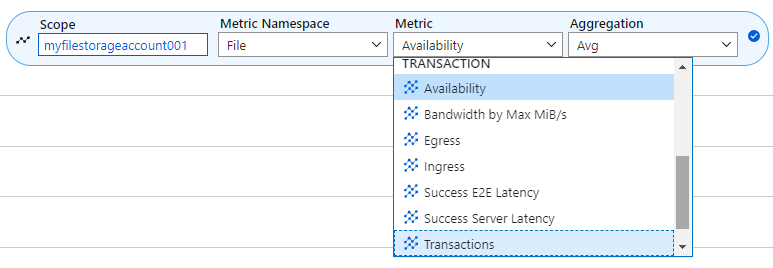
Now you can select a metric depending on what you want to monitor.
Monitor availability
In Azure Monitor, the Availability metric can be useful when something is visibly wrong from either an application or user perspective, or when troubleshooting alerts.
When using this metric with Azure Files, it’s important to always view the aggregation as Average as opposed to Max or Min. Using Average shows you what percentage of your requests are experiencing errors, and if they are within the SLA for Azure Files.
Monitor latency
The two most important latency metrics are Success E2E Latency and Success Server Latency. These are ideal metrics to select when starting any performance investigation. Average is the recommended aggregation. As previously mentioned, Max and Min can sometimes be misleading.
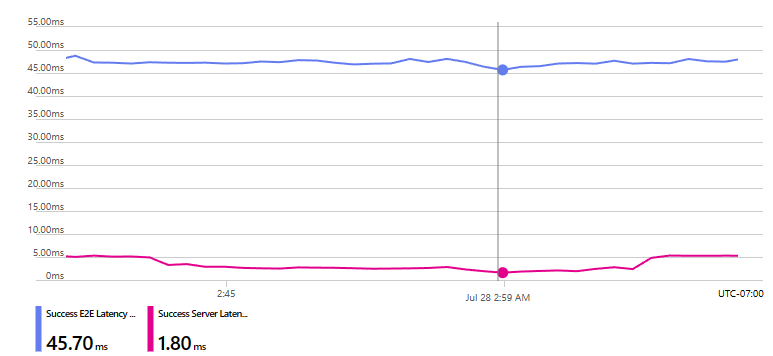
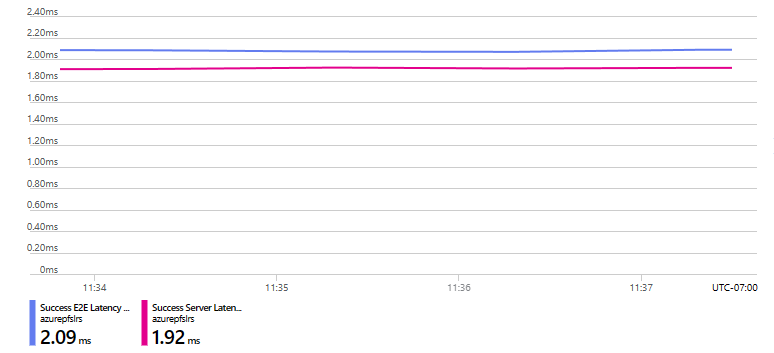
In the following charts, the blue line indicates how much time is spent in total latency (Success E2E Latency), and the pink line indicates time spent only in the Azure Files service (Success Server Latency).
This chart shows an on-premises client with a mounted Azure file share, representing, for example, a typical user connecting from a remote location. The physical distance between the client and Azure region is closely correlated to the corresponding client-side latency, which represents the difference between the E2E and Server latency.
In comparison, the following chart shows a situation where both the client and the Azure file share are located within the same region. Note that the client-side latency is only 0.17ms compared to 43.9ms in the first chart. This illustrates why minimizing client-side latency is imperative in order to achieve optimal performance.
Another latency indicator to look that for might suggest a problem is an increased frequency or abnormal spikes in Success Server Latency. This is commonly due to throttling due to exceeding the provisioned limit for a provisioned file share (or an overall scale limit a pay-as-you-go file share). See Understanding Azure Files billing and the Scalability and performance targets for Azure Files.
For more information, see Troubleshoot high latency, low throughput, or low IOPS.
Monitor utilization
Utilization metrics that measure the amount of data being transmitted (throughput) or operations being serviced (IOPS) are commonly used to determine how much work is being performed by the application or workload. Transaction metrics can determine the number of operations or requests against the Azure Files service over various time granularity.
If you're using the Egress or Ingress metrics to determine the volume of inbound or outbound data, use the Sum aggregation to determine the total amount of data being transmitted to and from the file share over a 1 minute to 1 day time granularity. Other aggregations such as Average, Max, and Min only display the value of the individual I/O size. This is why most customers typically see 1 MiB when using the Max aggregation. While it can be useful to understand the size of your largest, smallest, or even average I/O size, it isn't possible to display the distribution of I/O size generated by the workload's usage pattern.
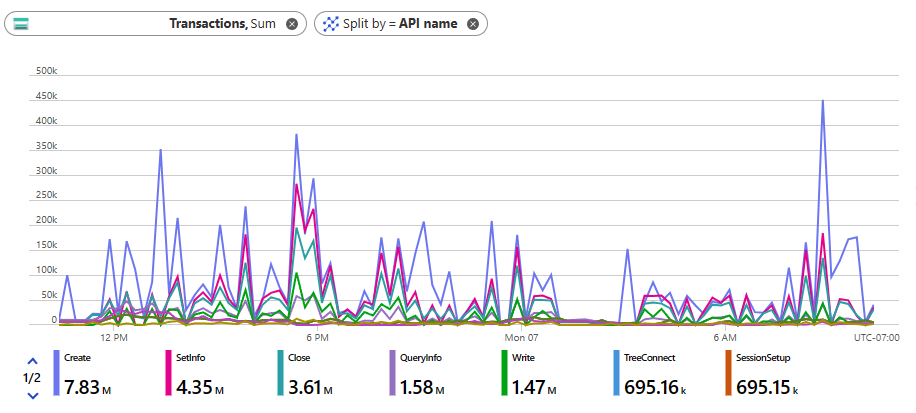
You can also select Apply splitting on response types (success, failures, errors) or API operations (read, write, create, close) to display additional details as shown in the following chart.
To determine the average I/O per second (IOPS) for your workload, first determine the total number of transactions over a minute and then divide that number by 60 seconds. For example, 120,000 transactions in 1 minute / 60 seconds = 2,000 average IOPS.
To determine the average throughput for your workload, take the total amount of transmitted data by combining the Ingress and Egress metrics (total throughput) and divide that by 60 seconds. For example, 1 GiB total throughput over 1 minute / 60 seconds = 17 MiB average throughput.
Monitor utilization by maximum IOPS and bandwidth (provisioned only)
Provisioned file shares provide Transactions by Max IOPS and Bandwidth by Max MiB/s metrics to display what your workload is achieving at peak times. Using these metrics to analyze your workload help you understand true capability at scale, as well as establish a baseline to understand the impact of more throughput and IOPS so you can optimally provision your Azure file share.
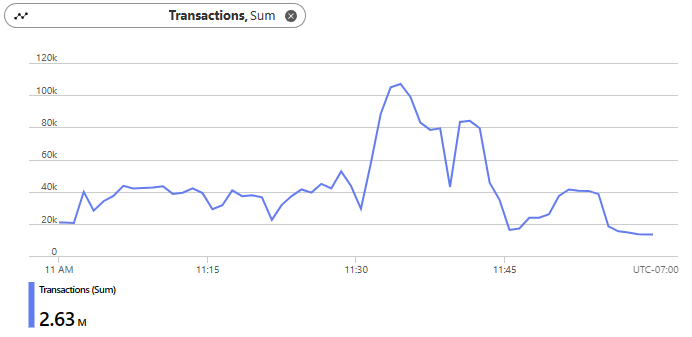
The following chart shows a workload that generated 2.63 million transactions over 1 hour. When 2.63 million transactions is divided by 3,600 seconds, we get an average of 730 IOPS.
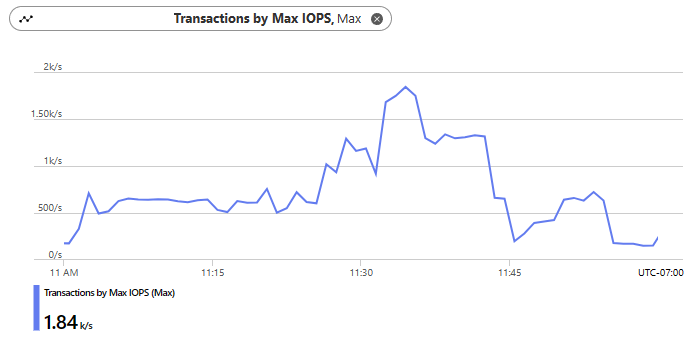
Now when we compare the average IOPS against the Transactions by Max IOPS, we see that under peak load we were achieving 1,840 IOPS, which is a better representation of the workload's ability at scale.
Select Add metric to combine the Ingress and Egress metrics on a single graph. This displays that 76.2 GiB (78,028 MiB) was transferred over one hour, which gives us an average throughput of 21.67 MiB over that same hour.
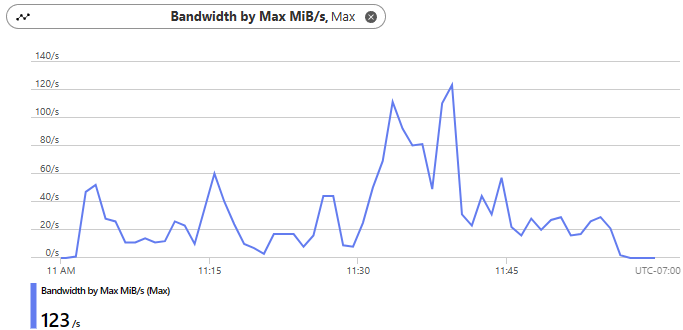
Compared against the Bandwidth by Max MiB/s, we achieved 123 MiB/s at peak.
