Note
Access to this page requires authorization. You can try signing in or changing directories.
Access to this page requires authorization. You can try changing directories.
Azure Files can satisfy performance requirements for most applications and use cases. This article explains the different factors that can affect file share performance and how to optimize the performance of Azure file shares for your workload.
Applies to
| Management model | Billing model | Media tier | Redundancy | SMB | NFS |
|---|---|---|---|---|---|
| Microsoft.Storage | Provisioned v1 | SSD (premium) | Local (LRS) | ||
| Microsoft.Storage | Provisioned v1 | SSD (premium) | Zone (ZRS) | ||
| Microsoft.Storage | Pay-as-you-go | HDD (standard) | Local (LRS) | ||
| Microsoft.Storage | Pay-as-you-go | HDD (standard) | Zone (ZRS) | ||
| Microsoft.Storage | Pay-as-you-go | HDD (standard) | Geo (GRS) | ||
| Microsoft.Storage | Pay-as-you-go | HDD (standard) | GeoZone (GZRS) |
Glossary
Before reading this article, it's helpful to understand some key terms relating to storage performance:
IO operations per second (IOPS)
IOPS, or input/output operations per second, measures the number of file system operations per second. The term "IO" is interchangeable with the terms "operation" and "transaction" in the Azure Files documentation.
I/O size
I/O size, sometimes referred to as block size, is the size of the request that an application uses to perform a single input/output (I/O) operation on storage. Depending on the application, I/O size can range from small sizes such as 4 KiB to larger sizes. I/O size plays a major role in achievable throughput.
Throughput
Throughput measures the number of bits read from or written to the storage per second, and is measured in mebibytes per second (MiB/s). To calculate throughput, multiply IOPS by I/O size. For example, 10,000 IOPS * 1 MiB I/O size = 10 GiB/s, while 10,000 IOPS * 4 KiB I/O size = 38 MiB/s.
Latency
Latency is a synonym for delay and is measured in milliseconds (ms). There are two types of latency: end-to-end latency and service latency. For more information, see Latency.
Queue depth
Queue depth is the number of pending I/O requests that a storage resource can handle at any one time. For more information, see Queue depth.
Choosing a media tier based on usage patterns
Azure Files provides a two storage media tiers allow you to balance performance and price: SSD and HDD. You pick the media tier of the file share at the storage account level, and once you create a storage account in a particular media tier you can't move to the other one without manually migrating to a new file share.
When choosing between SSD and HDD file shares, it's important to understand the requirements of the expected usage pattern you're planning to run on Azure Files. If you require large amounts of IOPS, fast data transfer speeds, or low latency, then you should choose SSD file shares.
The following table summarizes the expected performance targets between SSD and HDD file shares. For details, see Azure Files scalability and performance targets.
| Usage pattern requirements | SSD | HDD |
|---|---|---|
| Write latency (single-digit milliseconds) | Yes | Yes |
| Read latency (single-digit milliseconds) | Yes | No |
SSD file shares offer a provisioning model that guarantees the following performance profile based on share size. For more information, see the provisioned v1 model.
Performance checklist
Whether you're assessing performance requirements for a new or existing workload, understanding your usage patterns helps you achieve predictable performance.
Latency sensitivity: Workloads that are sensitive to read latency and have high visibility to end users are more suitable for SSD file shares, which can provide single-millisecond latency for both read and write operations (< 2 ms for small I/O size).
IOPS and throughput requirements: SSD file shares support larger IOPS and throughput limits than HDD file shares. See file share scale targets for more information.
Workload duration and frequency: Short (minutes) and infrequent (hourly) workloads are less likely to achieve the upper performance limits of HDD file shares compared to long-running, frequently occurring workloads. On SSD file shares, workload duration is helpful when determining the correct performance profile to use based on the provisioned storage, IOPS, and throughput. A common mistake is to run performance tests for only a few minutes, which is often misleading. To get a realistic view of performance, be sure to test at a sufficiently high frequency and duration.
Workload parallelization: For workloads that perform operations in parallel, such as through multiple threads, processes, or application instances on the same client, SSD file shares provide a clear advantage over HDD file shares: SMB Multichannel. See Improve SMB Azure file share performance for more information.
API operation distribution: Metadata heavy workloads, such as workloads that are performing read operations against a large number of files, are a better fit for SSD file shares. See Metadata or namespace heavy workload.
Latency
When thinking about latency, it's important to first understand how latency is determined with Azure Files. The most common measurements are the latency associated with end-to-end latency and service latency metrics. Using these transaction metrics can help identify client-side latency and/or networking issues by determining how much time your application traffic spends in transit to and from the client.
End-to-end latency (SuccessE2ELatency) is the total time it takes for a transaction to perform a complete round trip from the client, across the network, to the Azure Files service, and back to the client.
Service Latency (SuccessServerLatency) is the time it takes for a transaction to round-trip only within Azure Files. This doesn't include any client or network latency.
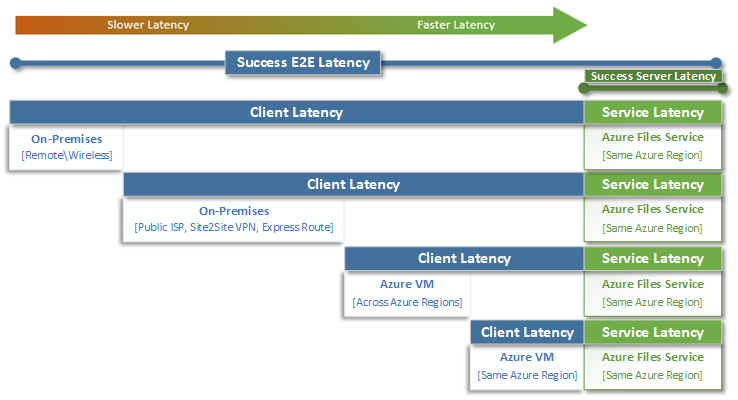
The difference between SuccessE2ELatency and SuccessServerLatency values is the latency likely caused by the network and/or the client.
It's common to confuse client latency with service latency (in this case, Azure Files performance). For example, if the service latency is reporting low latency and the end-to-end is reporting very high latency for requests, that suggests that all the time is spent in transit to and from the client, and not in the Azure Files service.
Furthermore, as the diagram illustrates, the farther you're away from the service, the slower the latency experience is, and the more difficult it's to achieve performance scale limits with any cloud service. This is especially true when accessing Azure Files from on premises. While options like ExpressRoute are ideal for on-premises, they still don't match the performance of an application (compute + storage) that's running exclusively in the same Azure region.
Tip
Using a VM in Azure to test performance between on-premises and Azure is an effective and practical way to baseline the networking capabilities of the connection to Azure. Undersized or incorrectly routed ExpressRoute circuits or VPN gateways can significantly slow down workloads running on Azure Files.
Queue depth
Queue depth is the number of outstanding I/O requests that a storage resource can service. As the disks used by storage systems have evolved from HDD spindles (IDE, SATA, SAS) to solid state devices (SSD, NVMe), they've also evolved to support higher queue depth. A workload consisting of a single client that serially interacts with a single file within a large dataset is an example of low queue depth. In contrast, a workload that supports parallelism with multiple threads and multiple files can easily achieve high queue depth. Because Azure Files is a distributed file service that spans thousands of Azure cluster nodes and is designed to run workloads at scale, we recommend building and testing workloads with high queue depth.
High queue depth can be achieved in several different ways in combination with clients, files, and threads. To determine the queue depth for your workload, multiply the number of clients by the number of files by the number of threads (clients * files * threads = queue depth).
The table below illustrates the various combinations you can use to achieve higher queue depth. While you can exceed the optimal queue depth of 64, we don't recommend it. You won't see any more performance gains if you do, and you risk increasing latency due to TCP saturation.
| Clients | Files | Threads | Queue depth |
|---|---|---|---|
| 1 | 1 | 1 | 1 |
| 1 | 1 | 2 | 2 |
| 1 | 2 | 2 | 4 |
| 2 | 2 | 2 | 8 |
| 2 | 2 | 4 | 16 |
| 2 | 4 | 4 | 32 |
| 1 | 8 | 8 | 64 |
| 4 | 4 | 2 | 64 |
Tip
To achieve upper performance limits, make sure that your workload or benchmarking test is multi-threaded with multiple files.
Single versus multi-thread applications
Azure Files is best suited for multi-threaded applications. The easiest way to understand the performance impact that multi-threading has on a workload is to walk through the scenario by I/O. In the following example, we have a workload that needs to copy 10,000 small files as quickly as possible to or from an Azure file share.
This table breaks down the time needed (in milliseconds) to create a single 16 KiB file on an Azure file share, based on a single-thread application that's writing in 4 KiB block sizes.
| I/O operation | Create | 4 KiB write | 4 KiB write | 4 KiB write | 4 KiB write | Close | Total |
|---|---|---|---|---|---|---|---|
| Thread 1 | 3 ms | 2 ms | 2 ms | 2 ms | 2 ms | 3 ms | 14 ms |
In this example, it would take approximately 14 ms to create a single 16 KiB file from the six operations. If a single-threaded application wants to move 10,000 files to an Azure file share, that translates to 140,000 ms (14 ms * 10,000) or 140 seconds because each file is moved sequentially one at a time. Keep in mind that the time to service each request is primarily determined by how close the compute and storage are located to each other, as discussed in the previous section.
By using eight threads instead of one, the above workload can be reduced from 140,000 ms (140 seconds) down to 17,500 ms (17.5 seconds). As the table below shows, when you're moving eight files in parallel instead of one file at a time, you can move the same amount of data in 87.5% less time.
| I/O operation | Create | 4 KiB write | 4 KiB write | 4 KiB write | 4 KiB write | Close | Total |
|---|---|---|---|---|---|---|---|
| Thread 1 | 3 ms | 2 ms | 2 ms | 2 ms | 2 ms | 3 ms | 14 ms |
| Thread 2 | 3 ms | 2 ms | 2 ms | 2 ms | 2 ms | 3 ms | 14 ms |
| Thread 3 | 3 ms | 2 ms | 2 ms | 2 ms | 2 ms | 3 ms | 14 ms |
| Thread 4 | 3 ms | 2 ms | 2 ms | 2 ms | 2 ms | 3 ms | 14 ms |
| Thread 5 | 3 ms | 2 ms | 2 ms | 2 ms | 2 ms | 3 ms | 14 ms |
| Thread 6 | 3 ms | 2 ms | 2 ms | 2 ms | 2 ms | 3 ms | 14 ms |
| Thread 7 | 3 ms | 2 ms | 2 ms | 2 ms | 2 ms | 3 ms | 14 ms |
| Thread 8 | 3 ms | 2 ms | 2 ms | 2 ms | 2 ms | 3 ms | 14 ms |