Autoinstrumentation, also referred to as runtime monitoring, is the easiest way to enable Application Insights for Azure App Service without requiring any code changes or advanced configurations. Based on your specific scenario, evaluate whether you require more advanced monitoring through manual instrumentation.
Note
On March 31, 2025, support for instrumentation key ingestion will end. Instrumentation key ingestion will continue to work, but we'll no longer provide updates or support for the feature. Transition to connection strings to take advantage of new capabilities.
Enable Application Insights
Important
If both autoinstrumentation monitoring and manual SDK-based instrumentation are detected, only the manual instrumentation settings are honored. This arrangement prevents duplicate data from being sent. To learn more, see Troubleshooting.
Autoinstrumentation in the Azure portal
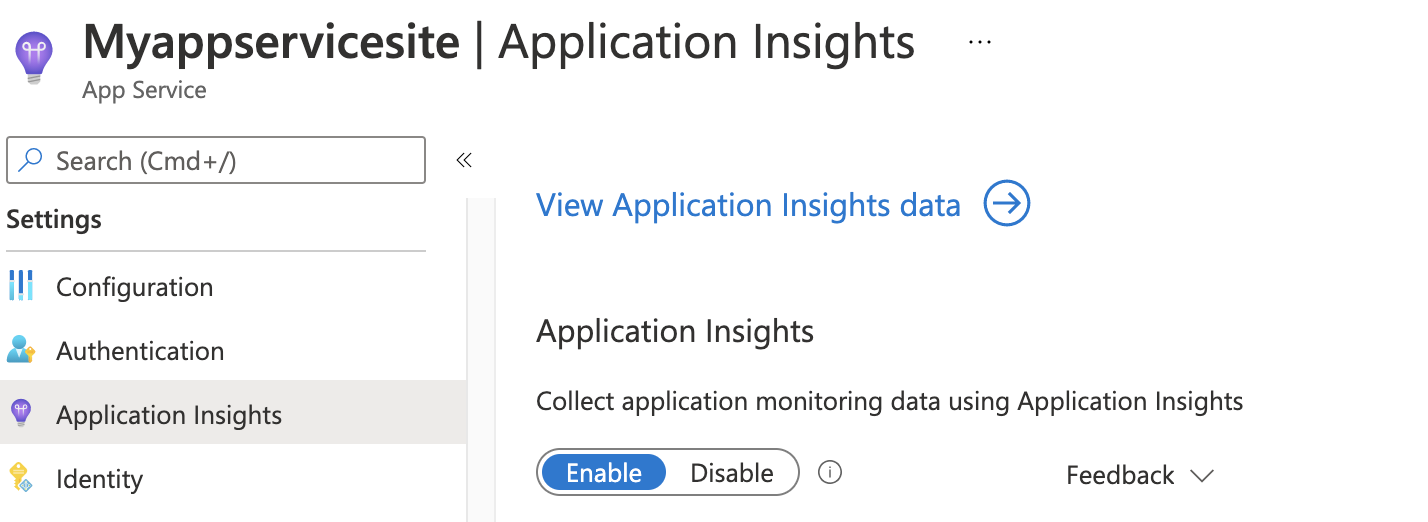
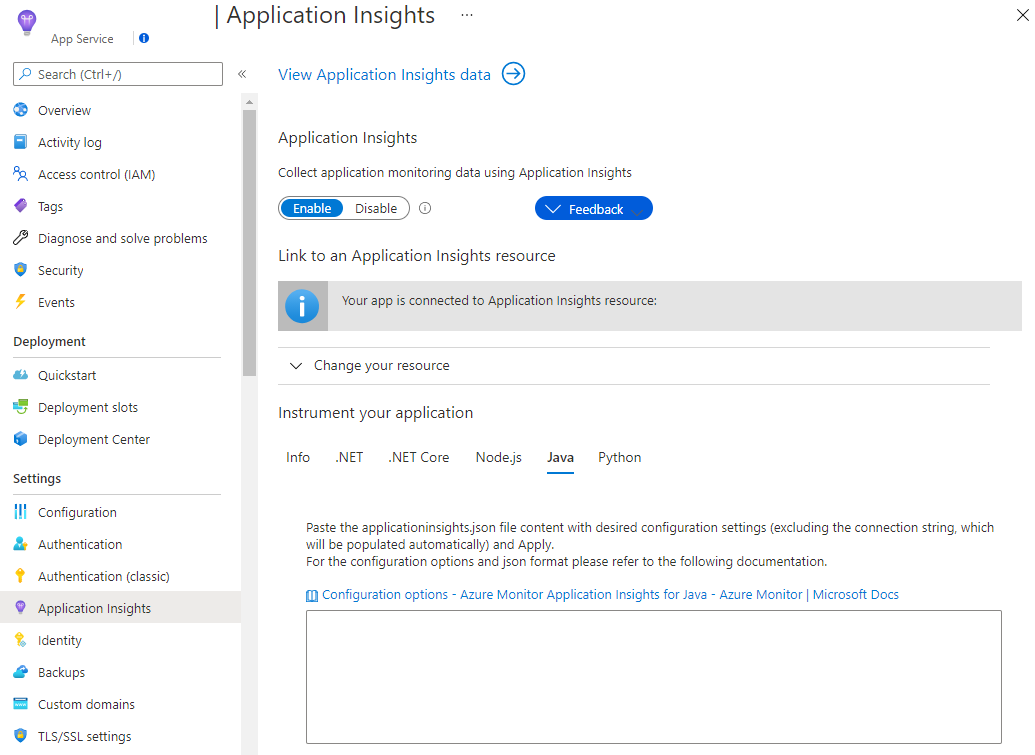
Select Application Insights in the left-hand navigation menu of your app service, then select Enable.
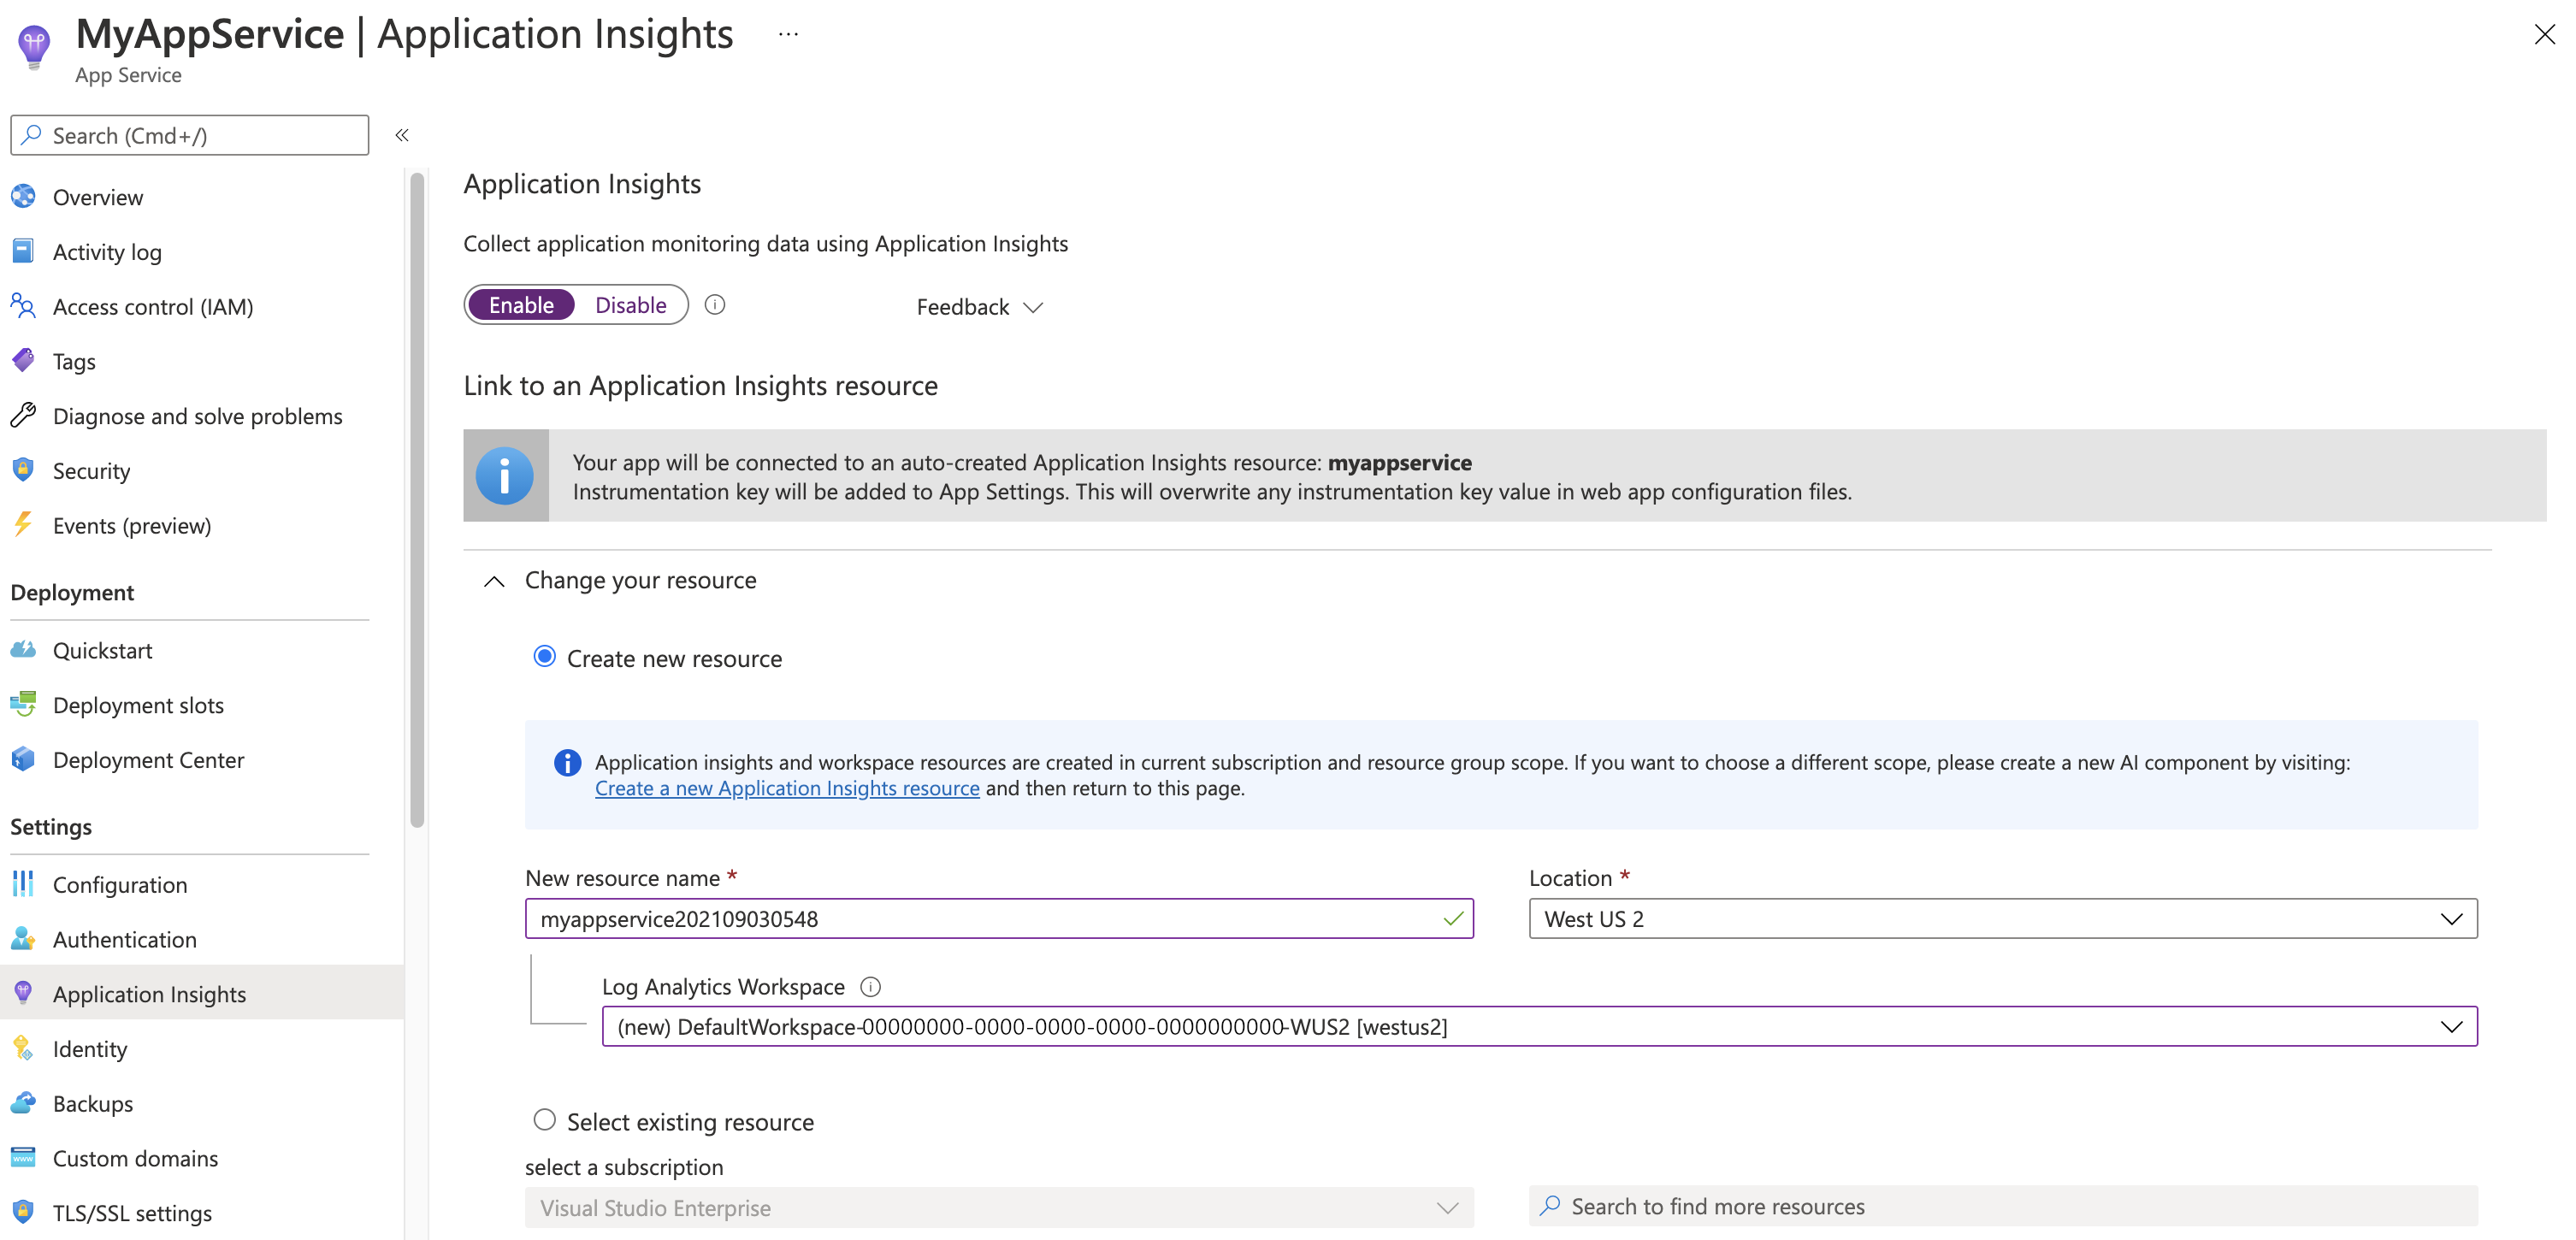
Create a new resource or select an existing Application Insights resource for this application.
Note
When you select OK to create a new resource, you're prompted to Apply monitoring settings. Selecting Continue links your new Application Insights resource to your app service. Your app service then restarts.
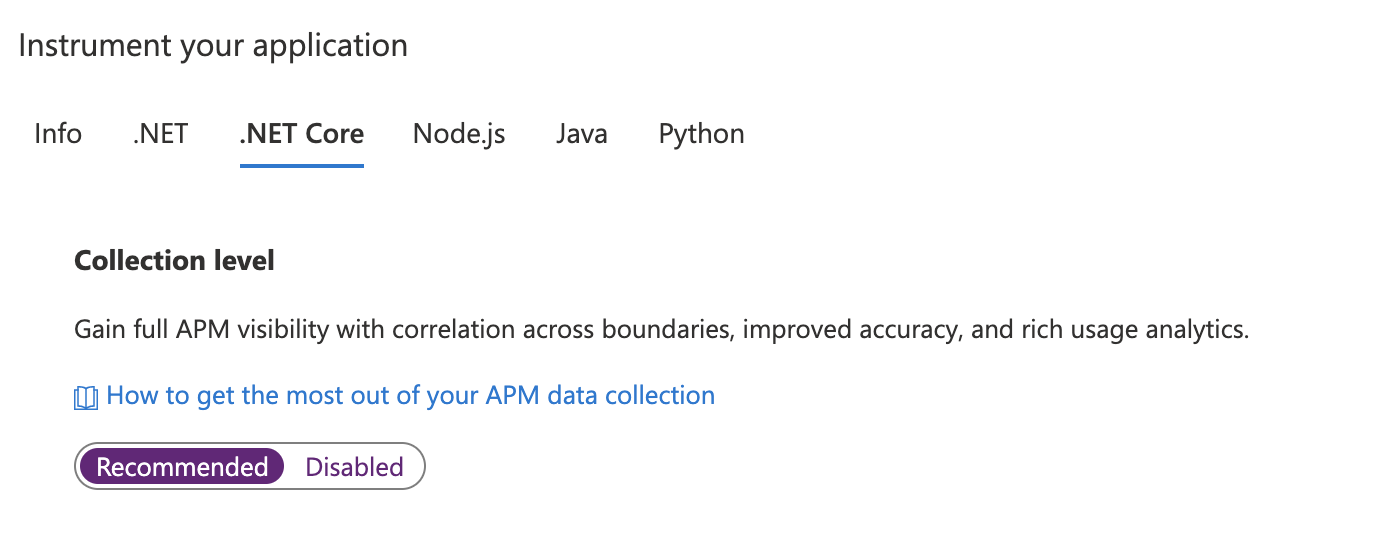
After you specify which resource to use, you can choose how you want Application Insights to collect data per platform for your application. ASP.NET Core collection options are Recommended or Disabled.
Important
If both autoinstrumentation monitoring and manual SDK-based instrumentation are detected, only the manual instrumentation settings are honored. This arrangement prevents duplicate data from being sent. To learn more, see Troubleshooting.
Note
The combination of APPINSIGHTS_JAVASCRIPT_ENABLED and urlCompression isn't supported. For more information, see Troubleshooting.
Autoinstrumentation in the Azure portal
Select Application Insights in the left-hand navigation menu of your app service, then select Enable.
Create a new resource or select an existing Application Insights resource for this application.
Note
When you select OK to create a new resource, you're prompted to Apply monitoring settings. Selecting Continue links your new Application Insights resource to your app service. Your app service then restarts.
After you specify which resource to use, you can choose how you want Application Insights to collect data per platform for your application. ASP.NET app monitoring is on by default with two different levels of collection, Recommended and Basic.
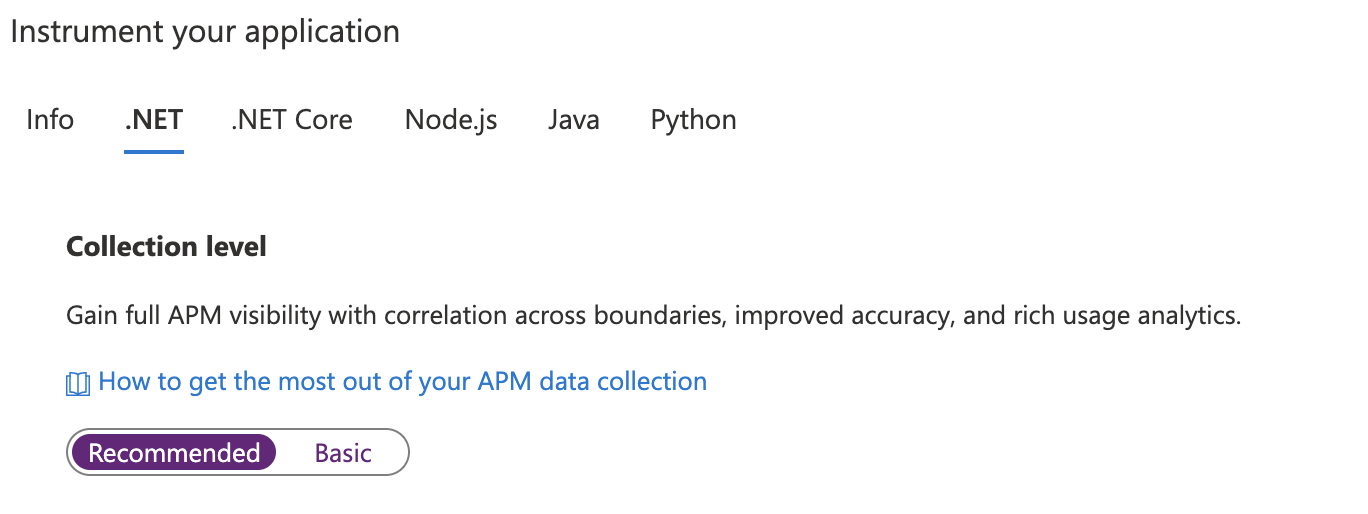
The following table summarizes the data collected for each route.
| Data |
Recommended |
Basic |
| Adds CPU, memory, and I/O usage trends |
Yes |
No |
| Collects usage trends, and enables correlation from availability results to transactions |
Yes |
Yes |
| Collects exceptions unhandled by the host process |
Yes |
Yes |
| Improves APM metrics accuracy under load, when sampling is used |
Yes |
Yes |
| Correlates micro-services across request/dependency boundaries |
Yes |
No (single-instance APM capabilities only) |
This integration adds Application Insights Java 3.x and autocollects telemetry. You can further apply extra configurations and add your own custom telemetry.
Autoinstrumentation in the Azure portal
Select Application Insights in the left-hand navigation menu of your app service, then select Enable.
Create a new resource or select an existing Application Insights resource for this application.
Note
When you select OK to create a new resource, you're prompted to Apply monitoring settings. Selecting Continue links your new Application Insights resource to your app service. Your app service then restarts.
Important
If both autoinstrumentation monitoring and manual SDK-based instrumentation are detected, only the manual instrumentation settings are honored. This arrangement prevents duplicate data from being sent. To learn more, see the Troubleshooting section.
Note
You can configure the automatically attached agent using the APPLICATIONINSIGHTS_CONFIGURATION_CONTENT environment variable in the App Service Environment variable blade. For details on the configuration options that can be passed via this environment variable, see Node.js Configuration.
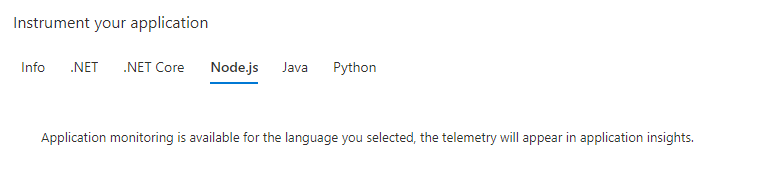
Application Insights for Node.js is integrated with Azure App Service on Linux - both code-based and custom containers, and with App Service on Windows for code-based apps. The integration is in public preview.
Autoinstrumentation in the Azure portal
Select Application Insights in the left-hand navigation menu of your app service, then select Enable.
Create a new resource or select an existing Application Insights resource for this application.
Note
When you select OK to create a new resource, you're prompted to Apply monitoring settings. Selecting Continue links your new Application Insights resource to your app service. Your app service then restarts.
Once you specified which resource to use, you're all set to go.
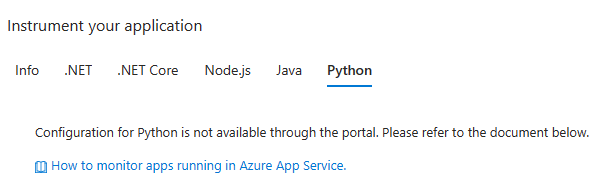
Application Insights for Python integrates with code-based Linux Azure App Service. The integration is in public preview and adds the Python SDK, which is in GA. It instruments popular Python libraries in your code, letting you automatically gather and correlate dependencies, logs, and metrics. To see which calls and metrics are collected, see Python libraries
Logging telemetry is collected at the level of the root logger. To learn more about Python's native logging hierarchy, visit the Python logging documentation.
Prerequisites
- Python version 3.11 or earlier.
- App Service must be deployed as code. Custom containers aren't supported.
Autoinstrumentation in the Azure portal
Select Application Insights in the left-hand navigation menu of your app service, then select Enable.
Create a new resource or select an existing Application Insights resource for this application.
Note
When you select OK to create a new resource, you're prompted to Apply monitoring settings. Selecting Continue links your new Application Insights resource to your app service. Your app service then restarts.
You specify the resource, and it's ready to use.
Python libraries
After instrumenting, you collect calls and metrics from these Python libraries:
Django instrumentation
In order to use the OpenTelemetry Django instrumentation, you need to set the DJANGO_SETTINGS_MODULE environment variable in the App Service settings to point from your app folder to your settings module.
For more information, see the Django documentation.
You can collect more data automatically when you include instrumentation libraries from the OpenTelemetry community.
Caution
We don't support or guarantee the quality of community instrumentation libraries. To suggest one for our distro, post or up-vote in our feedback community. Be aware, some are based on experimental OpenTelemetry specs and might introduce future breaking changes.
To add the community OpenTelemetry Instrumentation Library, install it via your app's requirements.txt file. OpenTelemetry autoinstrumentation automatically picks up and instruments all installed libraries. Find the list of community libraries here.
Manually upgrade the monitoring extension/agent
Upgrade from versions 2.8.9 and up
Upgrading from version 2.8.9 happens automatically, without any extra actions. The new monitoring bits are delivered in the background to the target app service, and are picked up on application restart.
To check which version of the extension you're running, go to https://yoursitename.scm.chinacloudsites.cn/ApplicationInsights.
Upgrade from versions 1.0.0 - 2.6.5
Starting with version 2.8.9, the preinstalled site extension is used. If you're using an earlier version, you can update via one of two ways:
Upgrade by enabling via the Azure portal: Even if you have the Application Insights extension for App Service installed, the UI shows only the Enable button. Behind the scenes, the old private site extension is removed.
Upgrade through PowerShell:
- Set the application settings to enable the preinstalled site extension
ApplicationInsightsAgent. For more information, see Enable through PowerShell.
- Manually remove the private site extension named Application Insights extension for Azure App Service.
If the upgrade is done from a version before 2.5.1, check that the ApplicationInsights DLLs are removed from the application bin folder. For more information, see Troubleshooting.
The Application Insights Java version is updated automatically as part of App Service updates. If you encounter an issue that got fixed in the latest version of the Application Insights Java agent, you can update it manually.
Upload the Java agent jar file to App Service.
a. First, get the latest version of Azure CLI by following the instructions here.
b. Next, get the latest version of the Application Insights Java agent by following the instructions here.
c. Then, deploy the Java agent jar file to App Service using the following command: az webapp deploy --src-path applicationinsights-agent-{VERSION_NUMBER}.jar --target-path java/applicationinsights-agent-{VERSION_NUMBER}.jar --type static --resource-group {YOUR_RESOURCE_GROUP} --name {YOUR_APP_SVC_NAME}. Alternatively, you can use this guide to deploy the agent through the Maven plugin.
Disable Application Insights via the Application Insights tab in the Azure portal.
Once the agent jar file is uploaded, go to App Service configurations. If you need to use Startup Command for Linux, include JVM arguments:
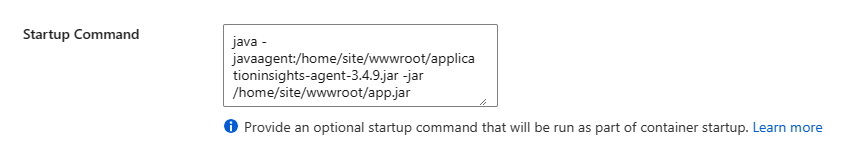
Startup Command doesn't honor JAVA_OPTS for JavaSE or CATALINA_OPTS for Tomcat.
If you don't use Startup Command, create a new environment variable, JAVA_OPTS for JavaSE or CATALINA_OPTS for Tomcat, with the value
-javaagent:{PATH_TO_THE_AGENT_JAR}/applicationinsights-agent-{VERSION_NUMBER}.jar.
To apply the changes, restart the app.
Note
If you set the JAVA_OPTS for JavaSE or CATALINA_OPTS for Tomcat environment variable, you have to disable Application Insights in the Azure portal. Alternatively, if you prefer to enable Application Insights from the Azure portal, make sure that you don't set the JAVA_OPTS for JavaSE or CATALINA_OPTS for Tomcat variable in App Service configurations settings.
The Application Insights Node.js version is updated automatically as part of App Service updates and can't be updated manually.
If you encounter an issue that got fixed in the latest version of the Application Insights SDK, you can remove autoinstrumentation and manually instrument your application with the most recent SDK version.
The Application Insights Python version is updated automatically as part of App Service updates and can't be updated manually.
We currently don't offer options to configure the monitoring extension for ASP.NET Core.
To configure sampling, which you could previously control via the applicationinsights.config file, you can now interact with it via application settings with the corresponding prefix MicrosoftAppInsights_AdaptiveSamplingTelemetryProcessor.
For example, to change the initial sampling percentage, you can create an application setting of MicrosoftAppInsights_AdaptiveSamplingTelemetryProcessor_InitialSamplingPercentage and a value of 100.
To disable sampling, set MicrosoftAppInsights_AdaptiveSamplingTelemetryProcessor_MinSamplingPercentage to a value of 100.
Supported settings include:
MicrosoftAppInsights_AdaptiveSamplingTelemetryProcessor_InitialSamplingPercentageMicrosoftAppInsights_AdaptiveSamplingTelemetryProcessor_MinSamplingPercentageMicrosoftAppInsights_AdaptiveSamplingTelemetryProcessor_EvaluationIntervalMicrosoftAppInsights_AdaptiveSamplingTelemetryProcessor_MaxTelemetryItemsPerSecond
For the list of supported adaptive sampling telemetry processor settings and definitions, see the code and sampling documentation.
After specifying which resource to use, you can configure the Java agent. If you don't configure the Java agent, default configurations apply.
The full set of configurations is available. You just need to paste a valid json file. Exclude the connection string and any configurations that are in preview - you're able to add the items that are currently in preview as they become generally available.
Once you modify the configurations through the Azure portal, APPLICATIONINSIGHTS_CONFIGURATION_FILE environment variable are automatically populated and appear in App Service settings panel. This variable contains the full json content that you pasted in the Azure portal configuration text box for your Java app.
The Node.js agent can be configured using JSON. Set the APPLICATIONINSIGHTS_CONFIGURATION_CONTENT environment variable to the JSON string or set the APPLICATIONINSIGHTS_CONFIGURATION_FILE environment variable to the file path containing the JSON.
"samplingPercentage": 80,
"enableAutoCollectExternalLoggers": true,
"enableAutoCollectExceptions": true,
"enableAutoCollectHeartbeat": true,
"enableSendLiveMetrics": true,
...
The full set of configurations is available. You just need to use a valid json file.
You can configure with OpenTelemetry environment variables such as:
| Environment Variable |
Description |
OTEL_SERVICE_NAME, OTEL_RESOURCE_ATTRIBUTES |
Specifies the OpenTelemetry Resource Attributes associated with your application. You can set any Resource Attributes with OTEL_RESOURCE_ATTRIBUTES or use OTEL_SERVICE_NAME to only set the service.name. |
OTEL_LOGS_EXPORTER |
If set to None, disables collection and export of logging telemetry. |
OTEL_METRICS_EXPORTER |
If set to None, disables collection and export of metric telemetry. |
OTEL_TRACES_EXPORTER |
If set to None, disables collection and export of distributed tracing telemetry. |
OTEL_BLRP_SCHEDULE_DELAY |
Specifies the logging export interval in milliseconds. Defaults to 5000. |
OTEL_BSP_SCHEDULE_DELAY |
Specifies the distributed tracing export interval in milliseconds. Defaults to 5000. |
OTEL_TRACES_SAMPLER_ARG |
Specifies the ratio of distributed tracing telemetry to be sampled. Accepted values range from 0 to 1. The default is 1.0, meaning no telemetry is sampled out. |
OTEL_PYTHON_DISABLED_INSTRUMENTATIONS |
Specifies which OpenTelemetry instrumentations to disable. When disabled, instrumentations aren't executed as part of autoinstrumentation. Accepts a comma-separated list of lowercase library names. For example, set it to "psycopg2,fastapi" to disable the Psycopg2 and FastAPI instrumentations. It defaults to an empty list, enabling all supported instrumentations. |
Enable client-side monitoring
Client-side monitoring is enabled by default for ASP.NET Core apps with Recommended collection, regardless of whether the app setting APPINSIGHTS_JAVASCRIPT_ENABLED is present.
If you want to disable client-side monitoring:
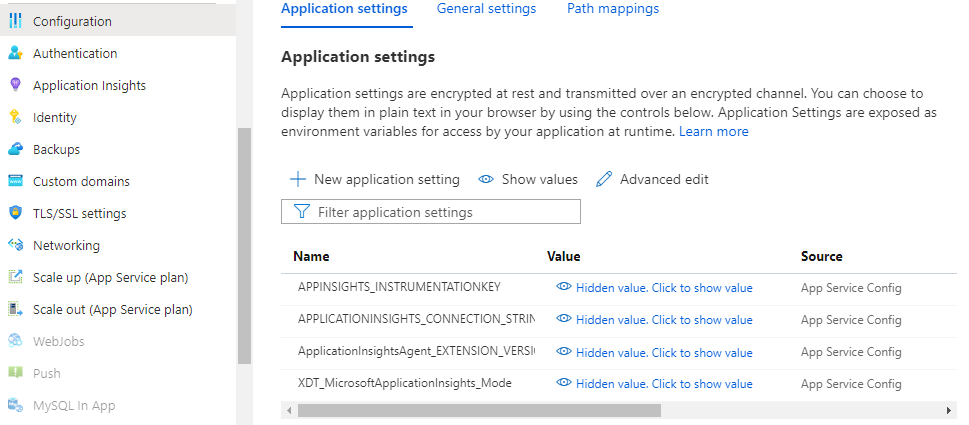
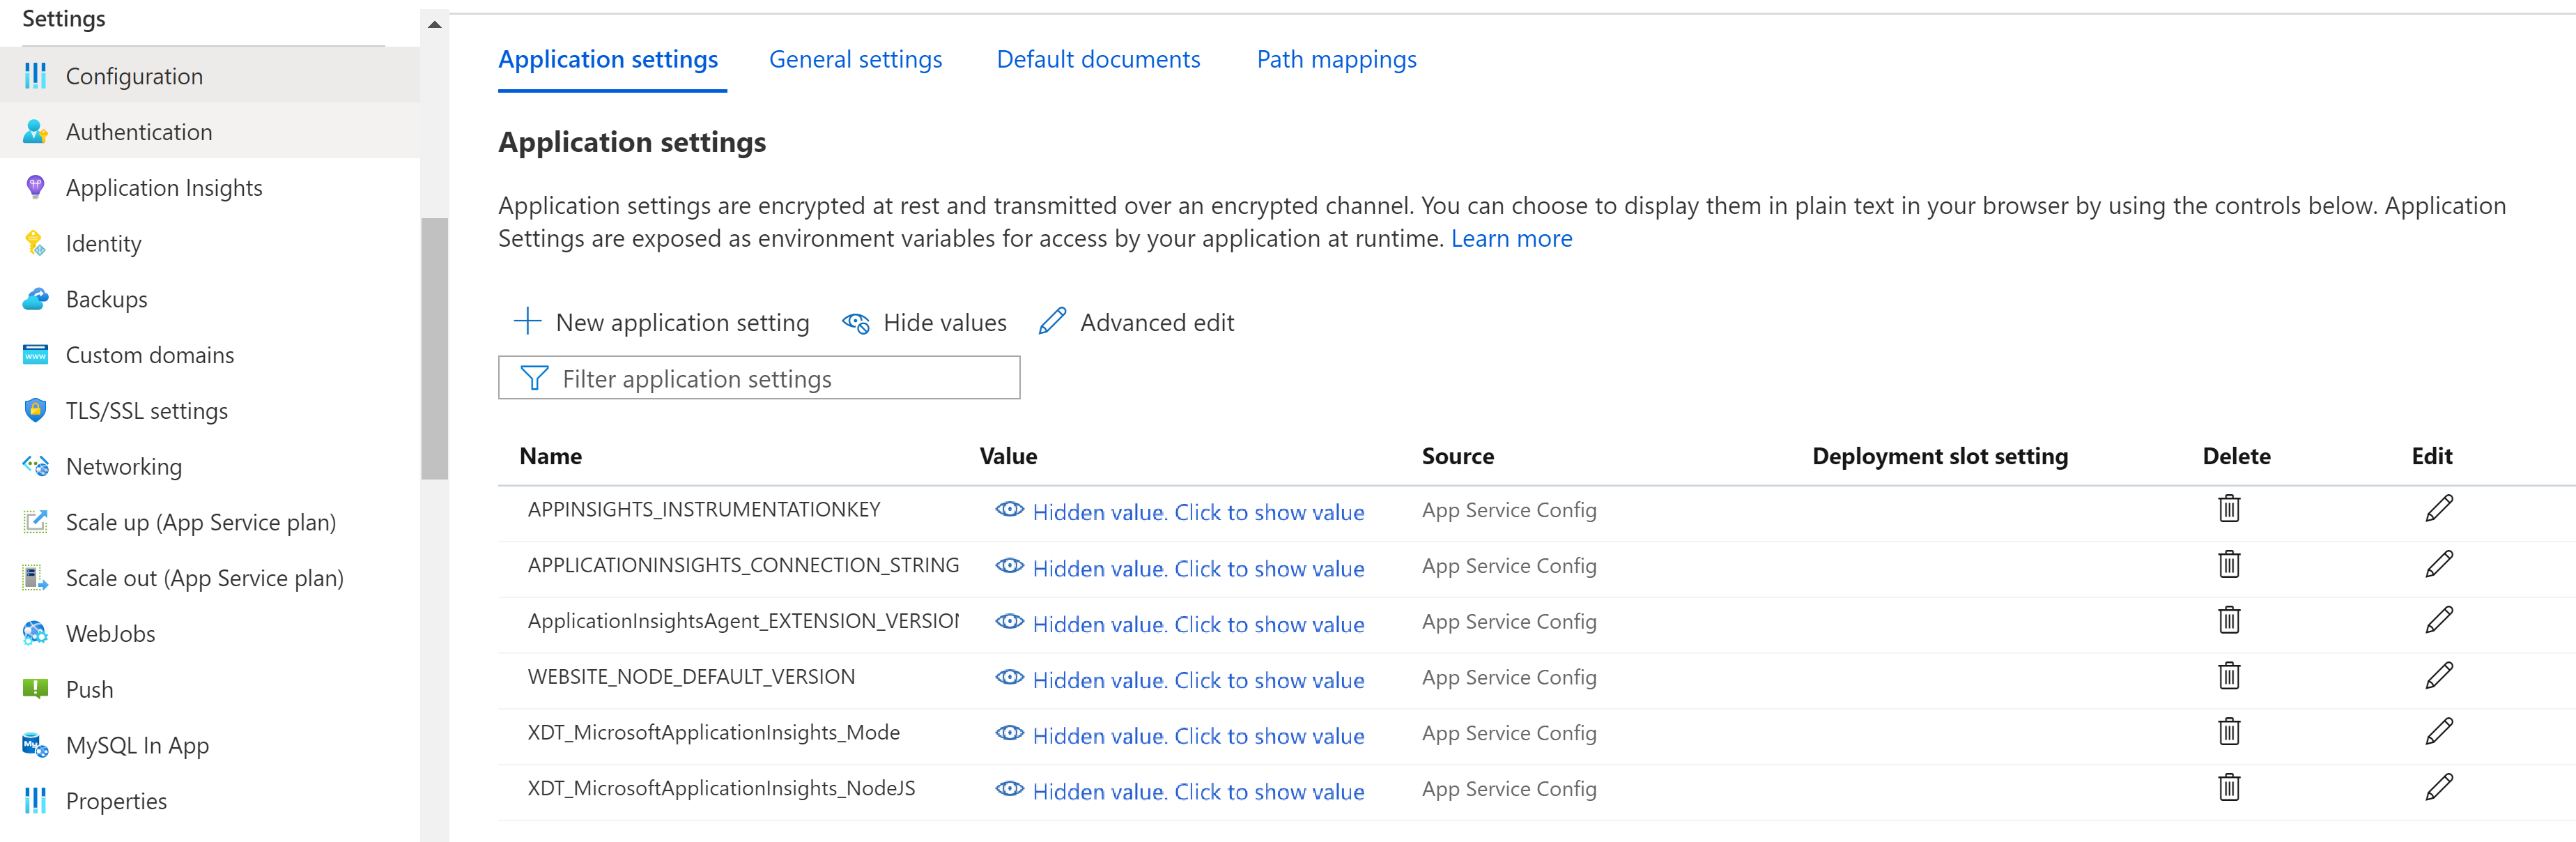
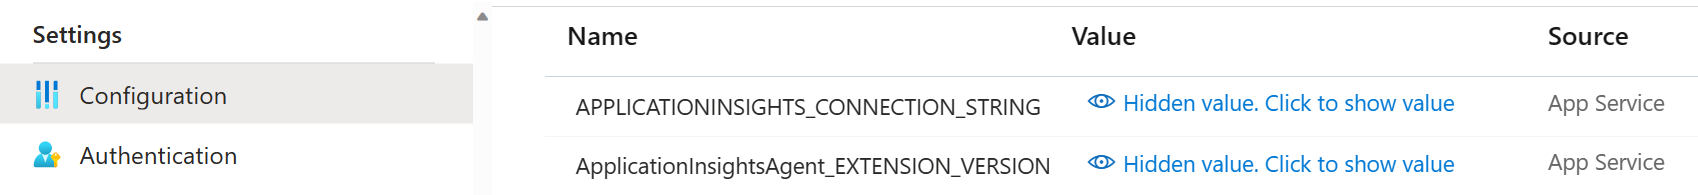
Select Settings > Configuration.
Under Application settings, create a New application setting with the following information:
- Name:
APPINSIGHTS_JAVASCRIPT_ENABLED
- Value:
false
Save the settings. Restart your app.
Client-side monitoring is an opt-in for ASP.NET. To enable client-side monitoring:
Select Settings > Configuration.
Under Application settings, create a new application setting:
- Name: Enter APPINSIGHTS_JAVASCRIPT_ENABLED.
- Value: Enter true.
Save the settings and restart your app.
To disable client-side monitoring, either remove the associated key value pair from Application settings or set the value to false.
Automate monitoring
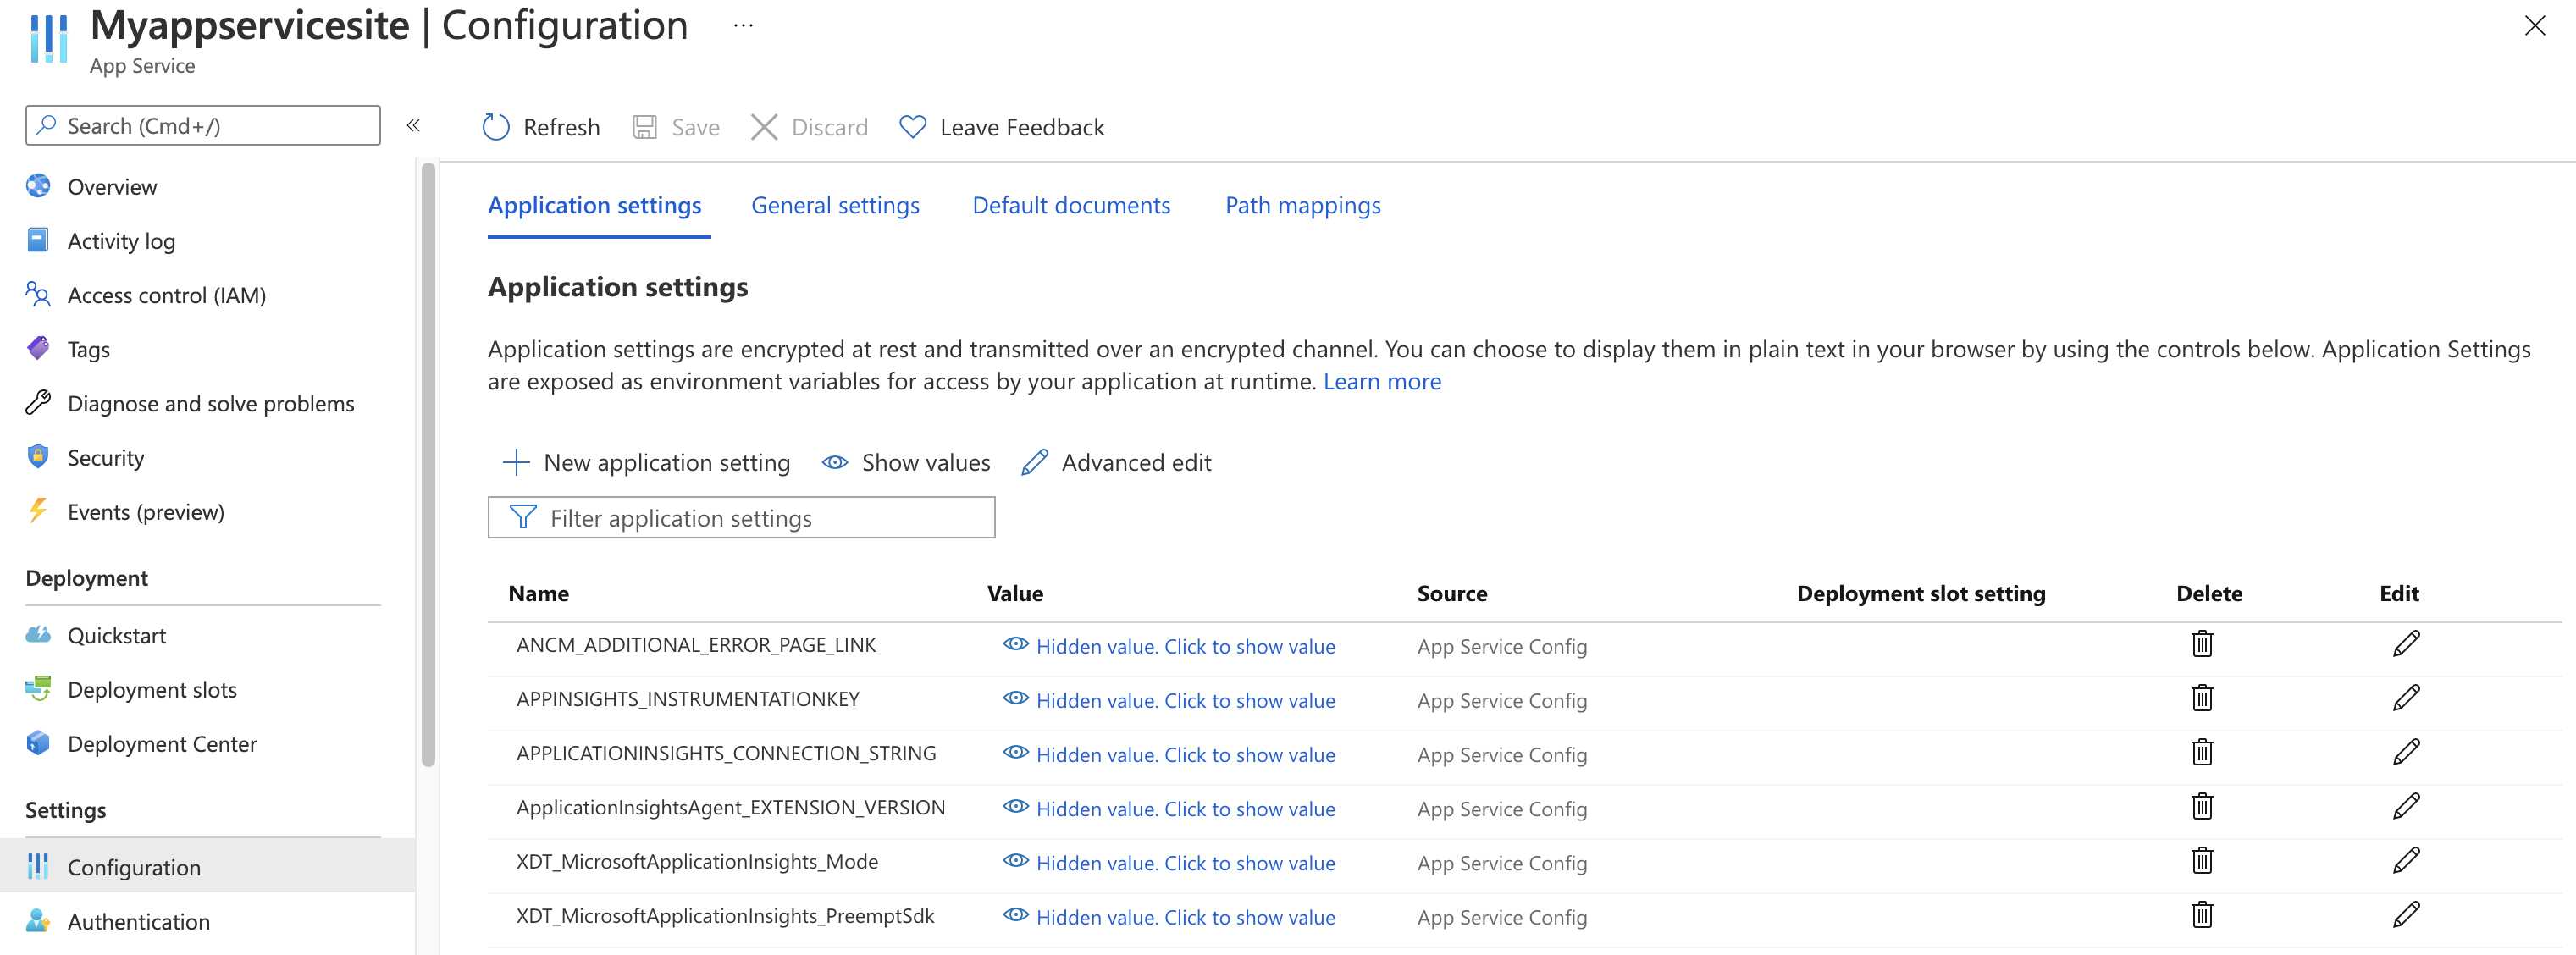
In order to enable telemetry collection with Application Insights, only the following Application settings need to be set:
Application settings definitions
| App setting name |
Definition |
Value |
| ApplicationInsightsAgent_EXTENSION_VERSION |
Main extension, which controls runtime monitoring. |
~2 for Windows or ~3 for Linux |
| XDT_MicrosoftApplicationInsights_Mode |
In default mode, only essential features are enabled to ensure optimal performance. |
disabled or recommended. |
| XDT_MicrosoftApplicationInsights_PreemptSdk |
For ASP.NET Core apps only. Enables Interop (interoperation) with the Application Insights SDK. Loads the extension side by side with the SDK and uses it to send telemetry. (Disables the Application Insights SDK.) |
1 |
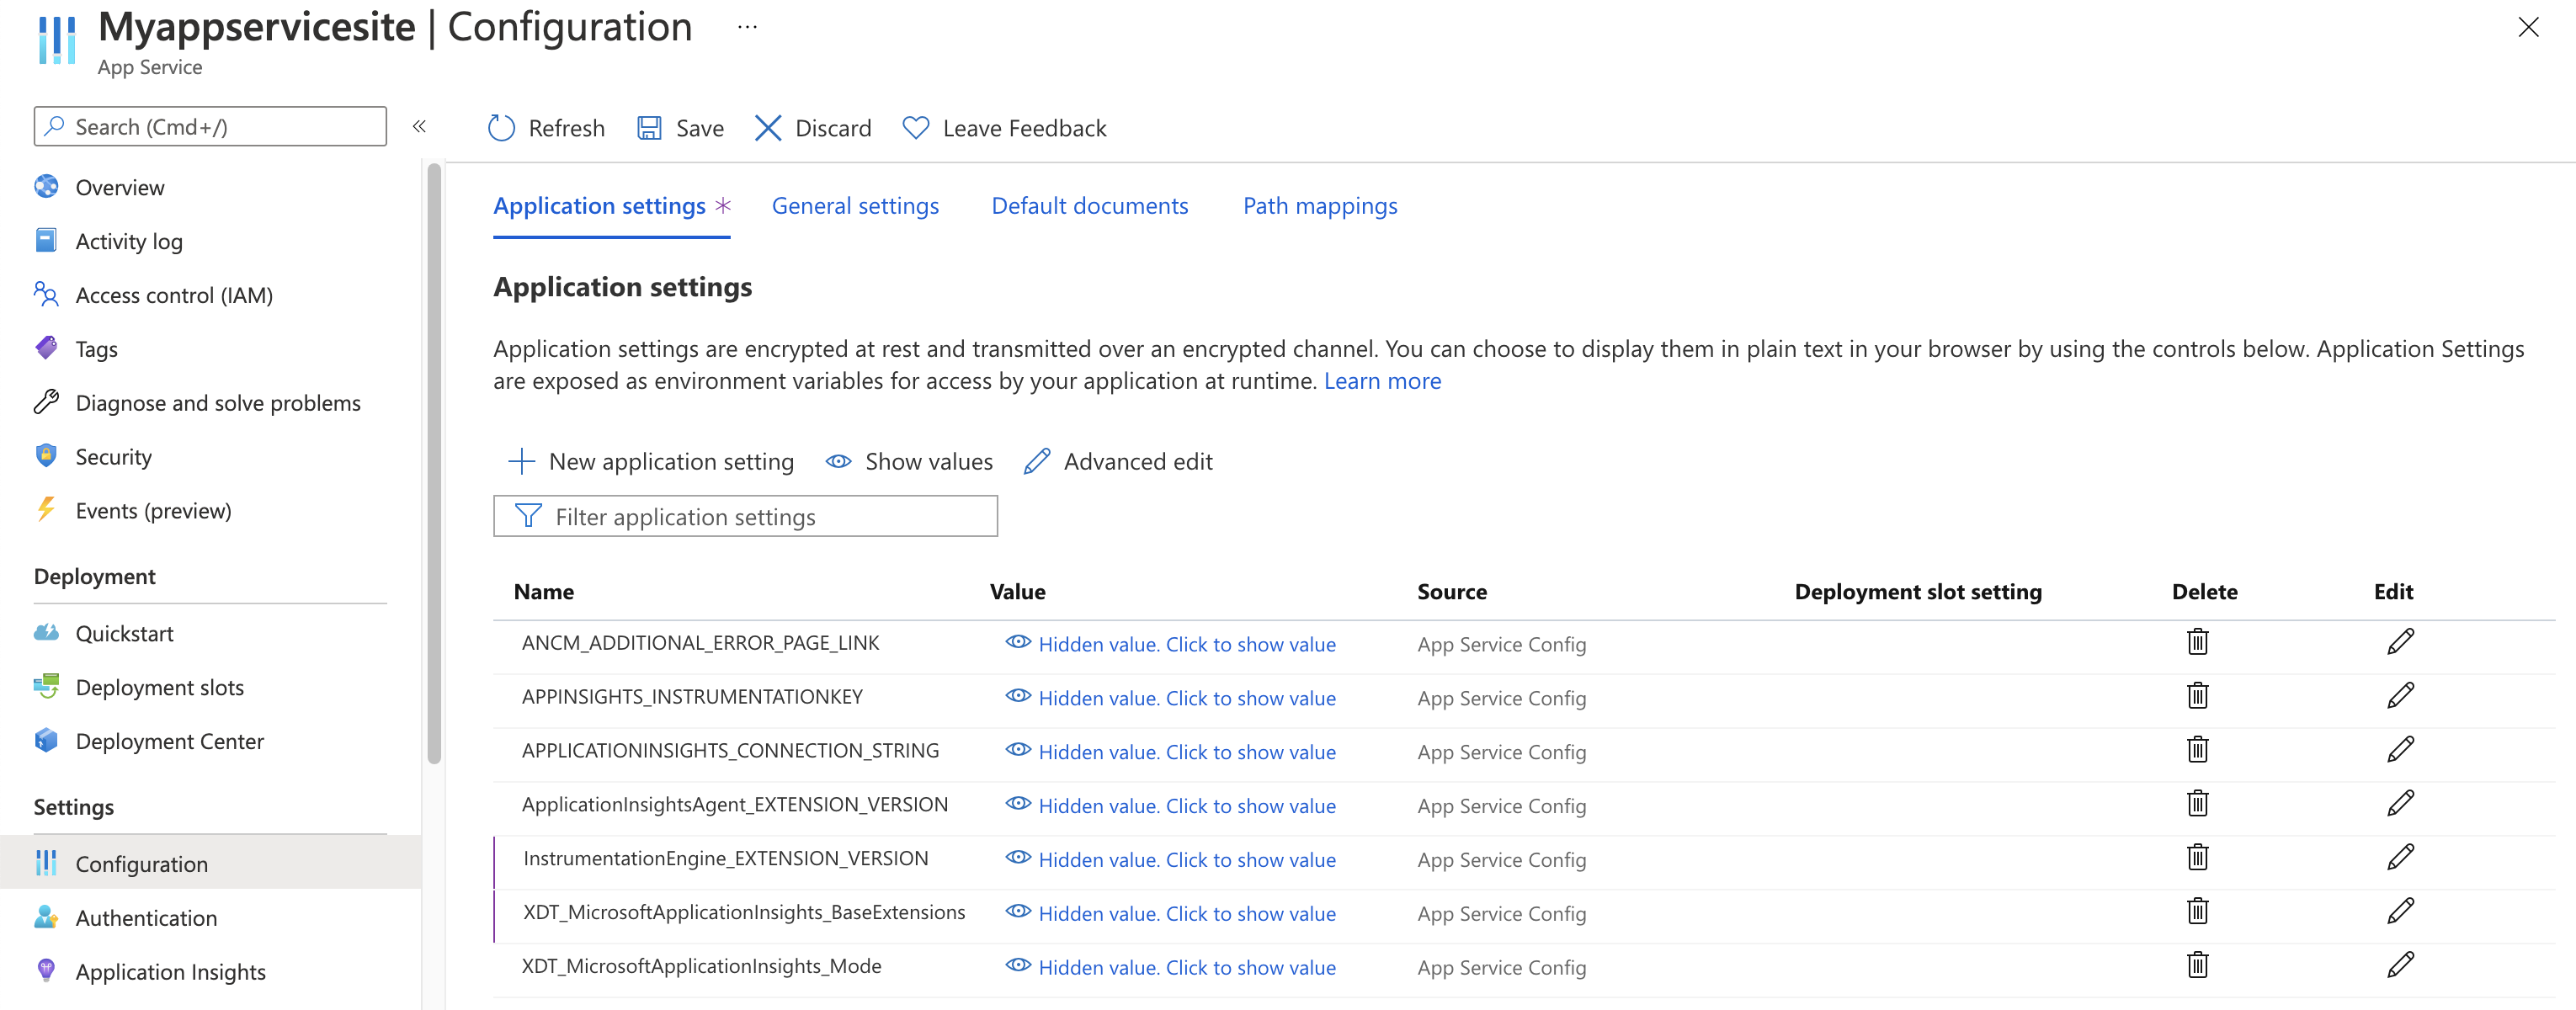
Application settings definitions
| App setting name |
Definition |
Value |
| ApplicationInsightsAgent_EXTENSION_VERSION |
Main extension, which controls runtime monitoring. |
~2 |
| XDT_MicrosoftApplicationInsights_Mode |
In default mode, only essential features are enabled to ensure optimal performance. |
default or recommended |
| InstrumentationEngine_EXTENSION_VERSION |
Controls if the binary-rewrite engine InstrumentationEngine are turned on. This setting has performance implications and affects cold start/startup time. |
~1 |
| XDT_MicrosoftApplicationInsights_BaseExtensions |
Controls if SQL and Azure table text are captured along with the dependency calls. Performance warning: Application cold startup time is affected. This setting requires the InstrumentationEngine. |
~1 |
Application settings definitions
| App setting name |
Definition |
Value |
| ApplicationInsightsAgent_EXTENSION_VERSION |
Main extension, which controls runtime monitoring. |
~2 in Windows or ~3 in Linux. |
| XDT_MicrosoftApplicationInsights_Java |
Flag to control if Java agent is included. |
0 or 1 (only applicable in Windows). |
Note
Snapshot Debugger isn't available for Java applications.
Application settings definitions
| App setting name |
Definition |
Value |
| ApplicationInsightsAgent_EXTENSION_VERSION |
Main extension, which controls runtime monitoring. |
~2 in Windows or ~3 in Linux. |
| XDT_MicrosoftApplicationInsights_NodeJS |
Flag to control if Node.js agent is included. |
0 or 1 (only applicable in Windows). |
Note
Snapshot Debugger isn't available for Node.js applications.
Application settings definitions
| App setting name |
Definition |
Value |
| APPLICATIONINSIGHTS_CONNECTION_STRING |
Connections string for your Application Insights resource. |
Example: abcd1234-ab12-cd34-abcd1234abcd |
| ApplicationInsightsAgent_EXTENSION_VERSION |
Main extension, which controls runtime monitoring. |
~3 |
Note
Snapshot Debugger isn't available for Python applications.
App Service application settings with Azure Resource Manager
Application settings for Azure App Service can be managed and configured with Azure Resource Manager templates. You can use this method when you deploy new App Service resources with Resource Manager automation or modify the settings of existing resources.
The basic structure of the application settings JSON for an App Service resource:
      "resources": [
        {
          "name": "appsettings",
          "type": "config",
          "apiVersion": "2015-08-01",
          "dependsOn": [
            "[resourceId('Microsoft.Web/sites', variables('webSiteName'))]"
          ],
          "tags": {
            "displayName": "Application Insights Settings"
          },
          "properties": {
            "key1": "value1",
            "key2": "value2"
          }
        }
      ]
Automate the creation of an Application Insights resource and link to your newly created App Service resource
To create a Resource Manager template with the default Application Insights settings, begin the process as if you were going to create a new web app with Application Insights enabled.
Create a new App Service resource with your desired web app information. Enable Application Insights on the Monitoring tab.
Select Review + create. Then select Download a template for automation.
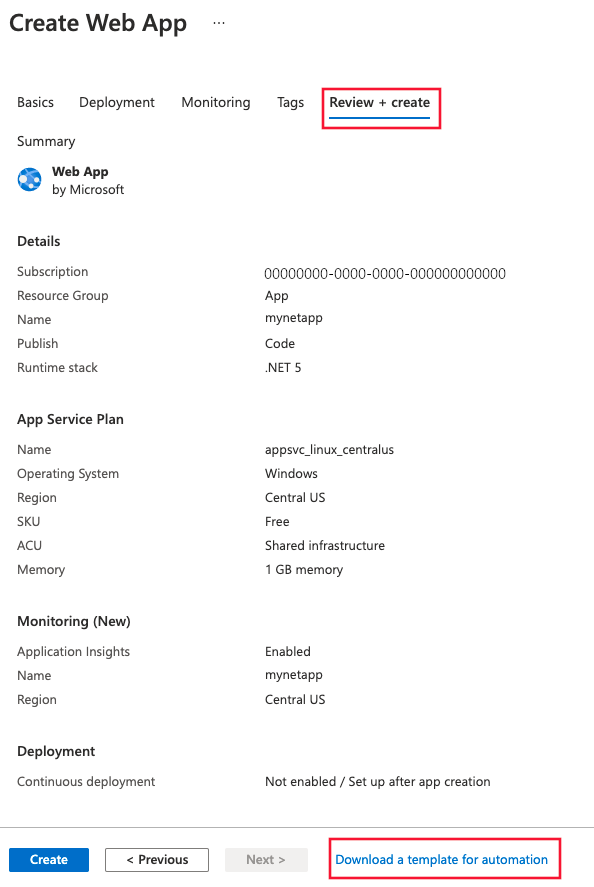
This option generates the latest Resource Manager template with all required settings configured.
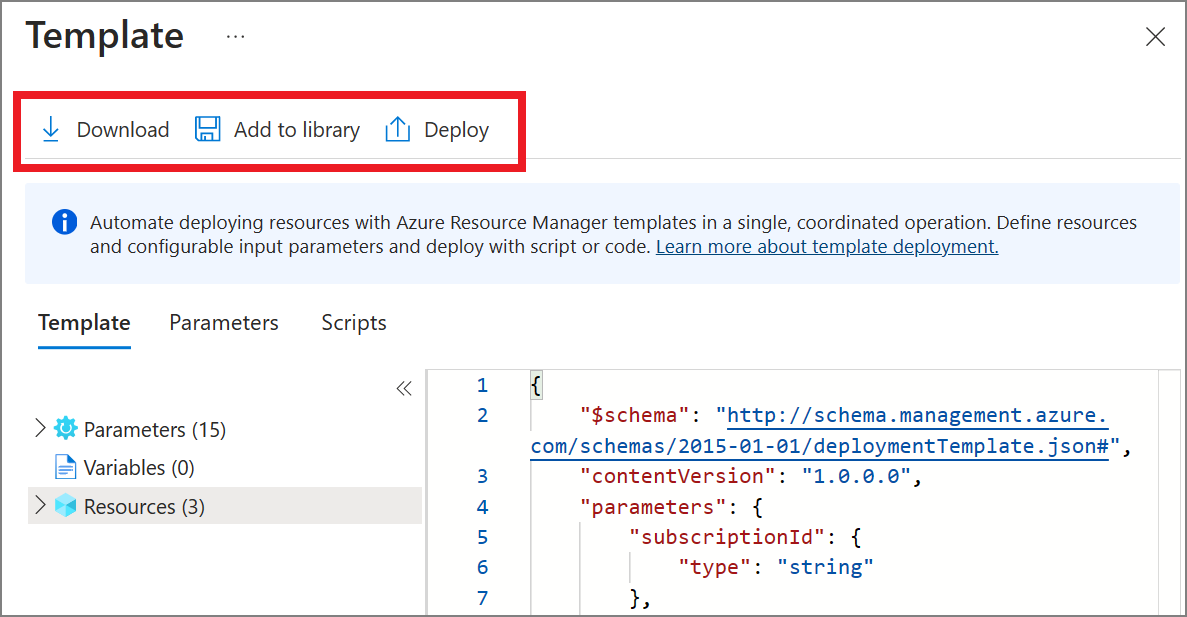
In the following sample, replace all instances of AppMonitoredSite with your site name:
Note
If using Windows, set ApplicationInsightsAgent_EXTENSION_VERSION to ~2. If using Linux, set ApplicationInsightsAgent_EXTENSION_VERSION to ~3.
{
    "resources": [
        {
            "name": "[parameters('name')]",
            "type": "Microsoft.Web/sites",
            "properties": {
                "siteConfig": {
                    "appSettings": [
                        {
                            "name": "APPINSIGHTS_INSTRUMENTATIONKEY",
                            "value": "[reference('microsoft.insights/components/AppMonitoredSite', '2015-05-01').InstrumentationKey]"
                        },
                        {
                            "name": "APPLICATIONINSIGHTS_CONNECTION_STRING",
                            "value": "[reference('microsoft.insights/components/AppMonitoredSite', '2015-05-01').ConnectionString]"
                        },
                        {
                            "name": "ApplicationInsightsAgent_EXTENSION_VERSION",
                            "value": "~2"
                        }
                    ]
                },
                "name": "[parameters('name')]",
                "serverFarmId": "[concat('/subscriptions/', parameters('subscriptionId'),'/resourcegroups/', parameters('serverFarmResourceGroup'), '/providers/Microsoft.Web/serverfarms/', parameters('hostingPlanName'))]",
                "hostingEnvironment": "[parameters('hostingEnvironment')]"
            },
            "dependsOn": [
                "[concat('Microsoft.Web/serverfarms/', parameters('hostingPlanName'))]",
                "microsoft.insights/components/AppMonitoredSite"
            ],
            "apiVersion": "2016-03-01",
            "location": "[parameters('location')]"
        },
        {
            "apiVersion": "2016-09-01",
            "name": "[parameters('hostingPlanName')]",
            "type": "Microsoft.Web/serverfarms",
            "location": "[parameters('location')]",
            "properties": {
                "name": "[parameters('hostingPlanName')]",
                "workerSizeId": "[parameters('workerSize')]",
                "numberOfWorkers": "1",
                "hostingEnvironment": "[parameters('hostingEnvironment')]"
            },
            "sku": {
                "Tier": "[parameters('sku')]",
                "Name": "[parameters('skuCode')]"
            }
        },
        {
            "apiVersion": "2015-05-01",
            "name": "AppMonitoredSite",
            "type": "microsoft.insights/components",
            "location": "China North 2",
            "properties": {
                "ApplicationId": "[parameters('name')]",
                "Request_Source": "IbizaWebAppExtensionCreate"
            }
        }
    ],
    "parameters": {
        "name": {
            "type": "string"
        },
        "hostingPlanName": {
            "type": "string"
        },
        "hostingEnvironment": {
            "type": "string"
        },
        "location": {
            "type": "string"
        },
        "sku": {
            "type": "string"
        },
        "skuCode": {
            "type": "string"
        },
        "workerSize": {
            "type": "string"
        },
        "serverFarmResourceGroup": {
            "type": "string"
        },
        "subscriptionId": {
            "type": "string"
        }
    },
    "$schema": "https://schema.management.azure.com/schemas/2014-04-01-preview/deploymentTemplate.json#",
    "contentVersion": "1.0.0.0"
}
Enable through PowerShell
To enable the application monitoring through PowerShell, only the underlying application settings must be changed. The following sample enables application monitoring for a website called AppMonitoredSite in the resource group AppMonitoredRG. It configures data to be sent to the 012345678-abcd-ef01-2345-6789abcd instrumentation key.
Note
If using Windows, set ApplicationInsightsAgent_EXTENSION_VERSION to ~2. If using Linux, set ApplicationInsightsAgent_EXTENSION_VERSION to ~3.
$app = Get-AzWebApp -ResourceGroupName "AppMonitoredRG" -Name "AppMonitoredSite" -ErrorAction Stop
$newAppSettings = @{} # case-insensitive hash map
$app.SiteConfig.AppSettings | %{$newAppSettings[$_.Name] = $_.Value} # preserve non Application Insights application settings.
$newAppSettings["APPINSIGHTS_INSTRUMENTATIONKEY"] = "012345678-abcd-ef01-2345-6789abcd"; # set the Application Insights instrumentation key
$newAppSettings["APPLICATIONINSIGHTS_CONNECTION_STRING"] = "InstrumentationKey=012345678-abcd-ef01-2345-6789abcd"; # set the Application Insights connection string
$newAppSettings["ApplicationInsightsAgent_EXTENSION_VERSION"] = "~2"; # enable the ApplicationInsightsAgent
$app = Set-AzWebApp -AppSettings $newAppSettings -ResourceGroupName $app.ResourceGroup -Name $app.Name -ErrorAction Stop
Frequently asked questions
This section provides answers to common questions.
What does Application Insights modify in my project?
The details depend on the type of project. The following list is an example for a web application.
Adds files to your project:
- ApplicationInsights.config
- ai.js
Installs NuGet packages:
- Application Insights API: The core API
- Application Insights API for Web Applications: Used to send telemetry from the server
- Application Insights API for JavaScript Applications: Used to send telemetry from the client
Includes assemblies in packages:
- Microsoft.ApplicationInsights
- Microsoft.ApplicationInsights.Platform
Inserts items into:
- Web.config
- packages.config
Inserts snippets into the client and server code to initialize them with the Application Insights resource ID. For example, in an MVC app, code is inserted into the main page Views/Shared/_Layout.cshtml. For new projects only, you add Application Insights to an existing project manually.
What's the difference between standard metrics from Application Insights vs. Azure App Service metrics?
Application Insights collects telemetry for the requests that made it to the application. If the failure occurs in WebApps/WebServer, and the request didn't reach the user application, Application Insights doesn't have any telemetry about it.
The duration for serverresponsetime calculated by Application Insights doesn't necessarily match the server response time observed by Web Apps. This behavior is because Application Insights only counts the duration when the request actually reaches the user application. If the request is stuck or queued in WebServer, the waiting time is included in the Web Apps metrics but not in Application Insights metrics.
Troubleshooting
Test connectivity between your application host and the ingestion service
Application Insights SDKs and agents send telemetry to get ingested as REST calls to our ingestion endpoints. You can test connectivity from your web server or application host machine to the ingestion service endpoints by using raw REST clients from PowerShell or curl commands. See Troubleshoot missing application telemetry in Azure Monitor Application Insights.
Note
When you create a web app with the ASP.NET Core runtimes in App Service, it deploys a single static HTML page as a starter website. We do not recommend that you troubleshoot an issue with the default template. Deploy an application before you troubleshoot an issue.
Missing telemetry
Windows
Check that the ApplicationInsightsAgent_EXTENSION_VERSION app setting is set to a value of ~2.
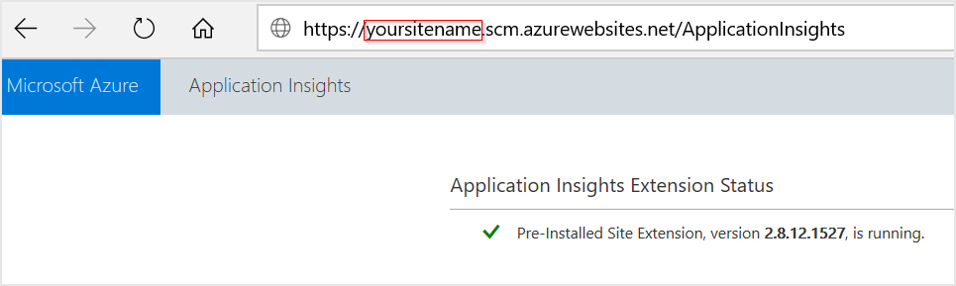
Browse to https://yoursitename.scm.chinacloudsites.cn/ApplicationInsights.
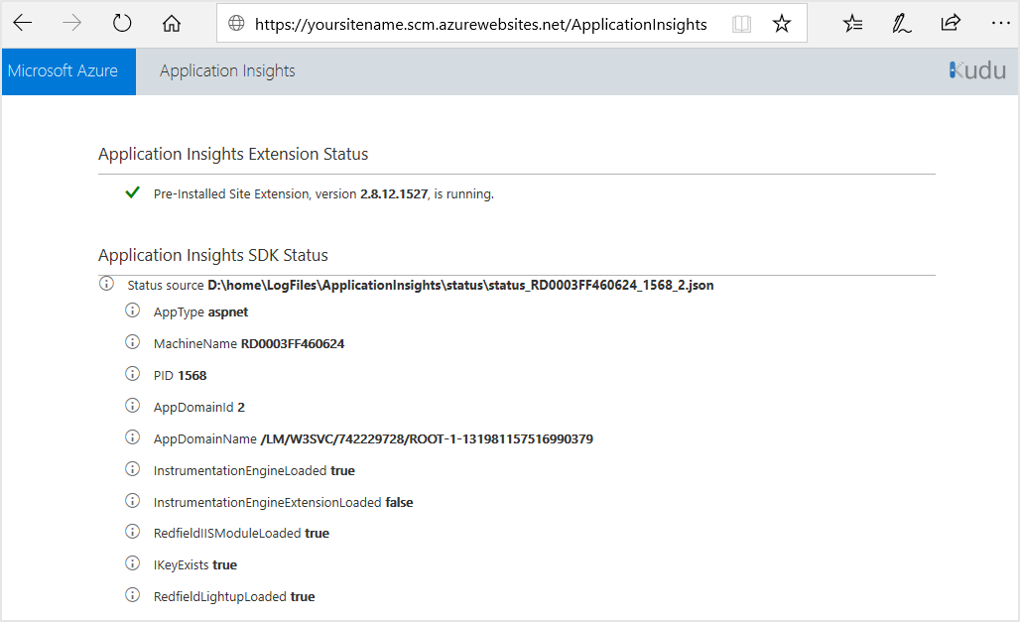
Confirm that Application Insights Extension Status is Pre-Installed Site Extension, version 2.8.x.xxxx, is running.
If it isn't running, follow the instructions in the section Enable Application Insights monitoring.
Confirm that the status source exists and looks like Status source D:\home\LogFiles\ApplicationInsights\status\status_RD0003FF0317B6_4248_1.json.
If a similar value isn't present, it means the application isn't currently running or isn't supported. To ensure that the application is running, try manually visiting the application URL/application endpoints, which allows the runtime information to become available.
Confirm that IKeyExists is True. If it's False, add APPINSIGHTS_INSTRUMENTATIONKEY and APPLICATIONINSIGHTS_CONNECTION_STRING with your ikey GUID to your application settings.
If your application refers to any Application Insights packages, enabling the App Service integration might not take effect, and the data might not appear in Application Insights. An example would be if you previously instrumented, or attempted to instrument, your app with the ASP.NET Core SDK. To fix the issue, in the Azure portal, turn on Interop with Application Insights SDK.
Important
This functionality is in preview.
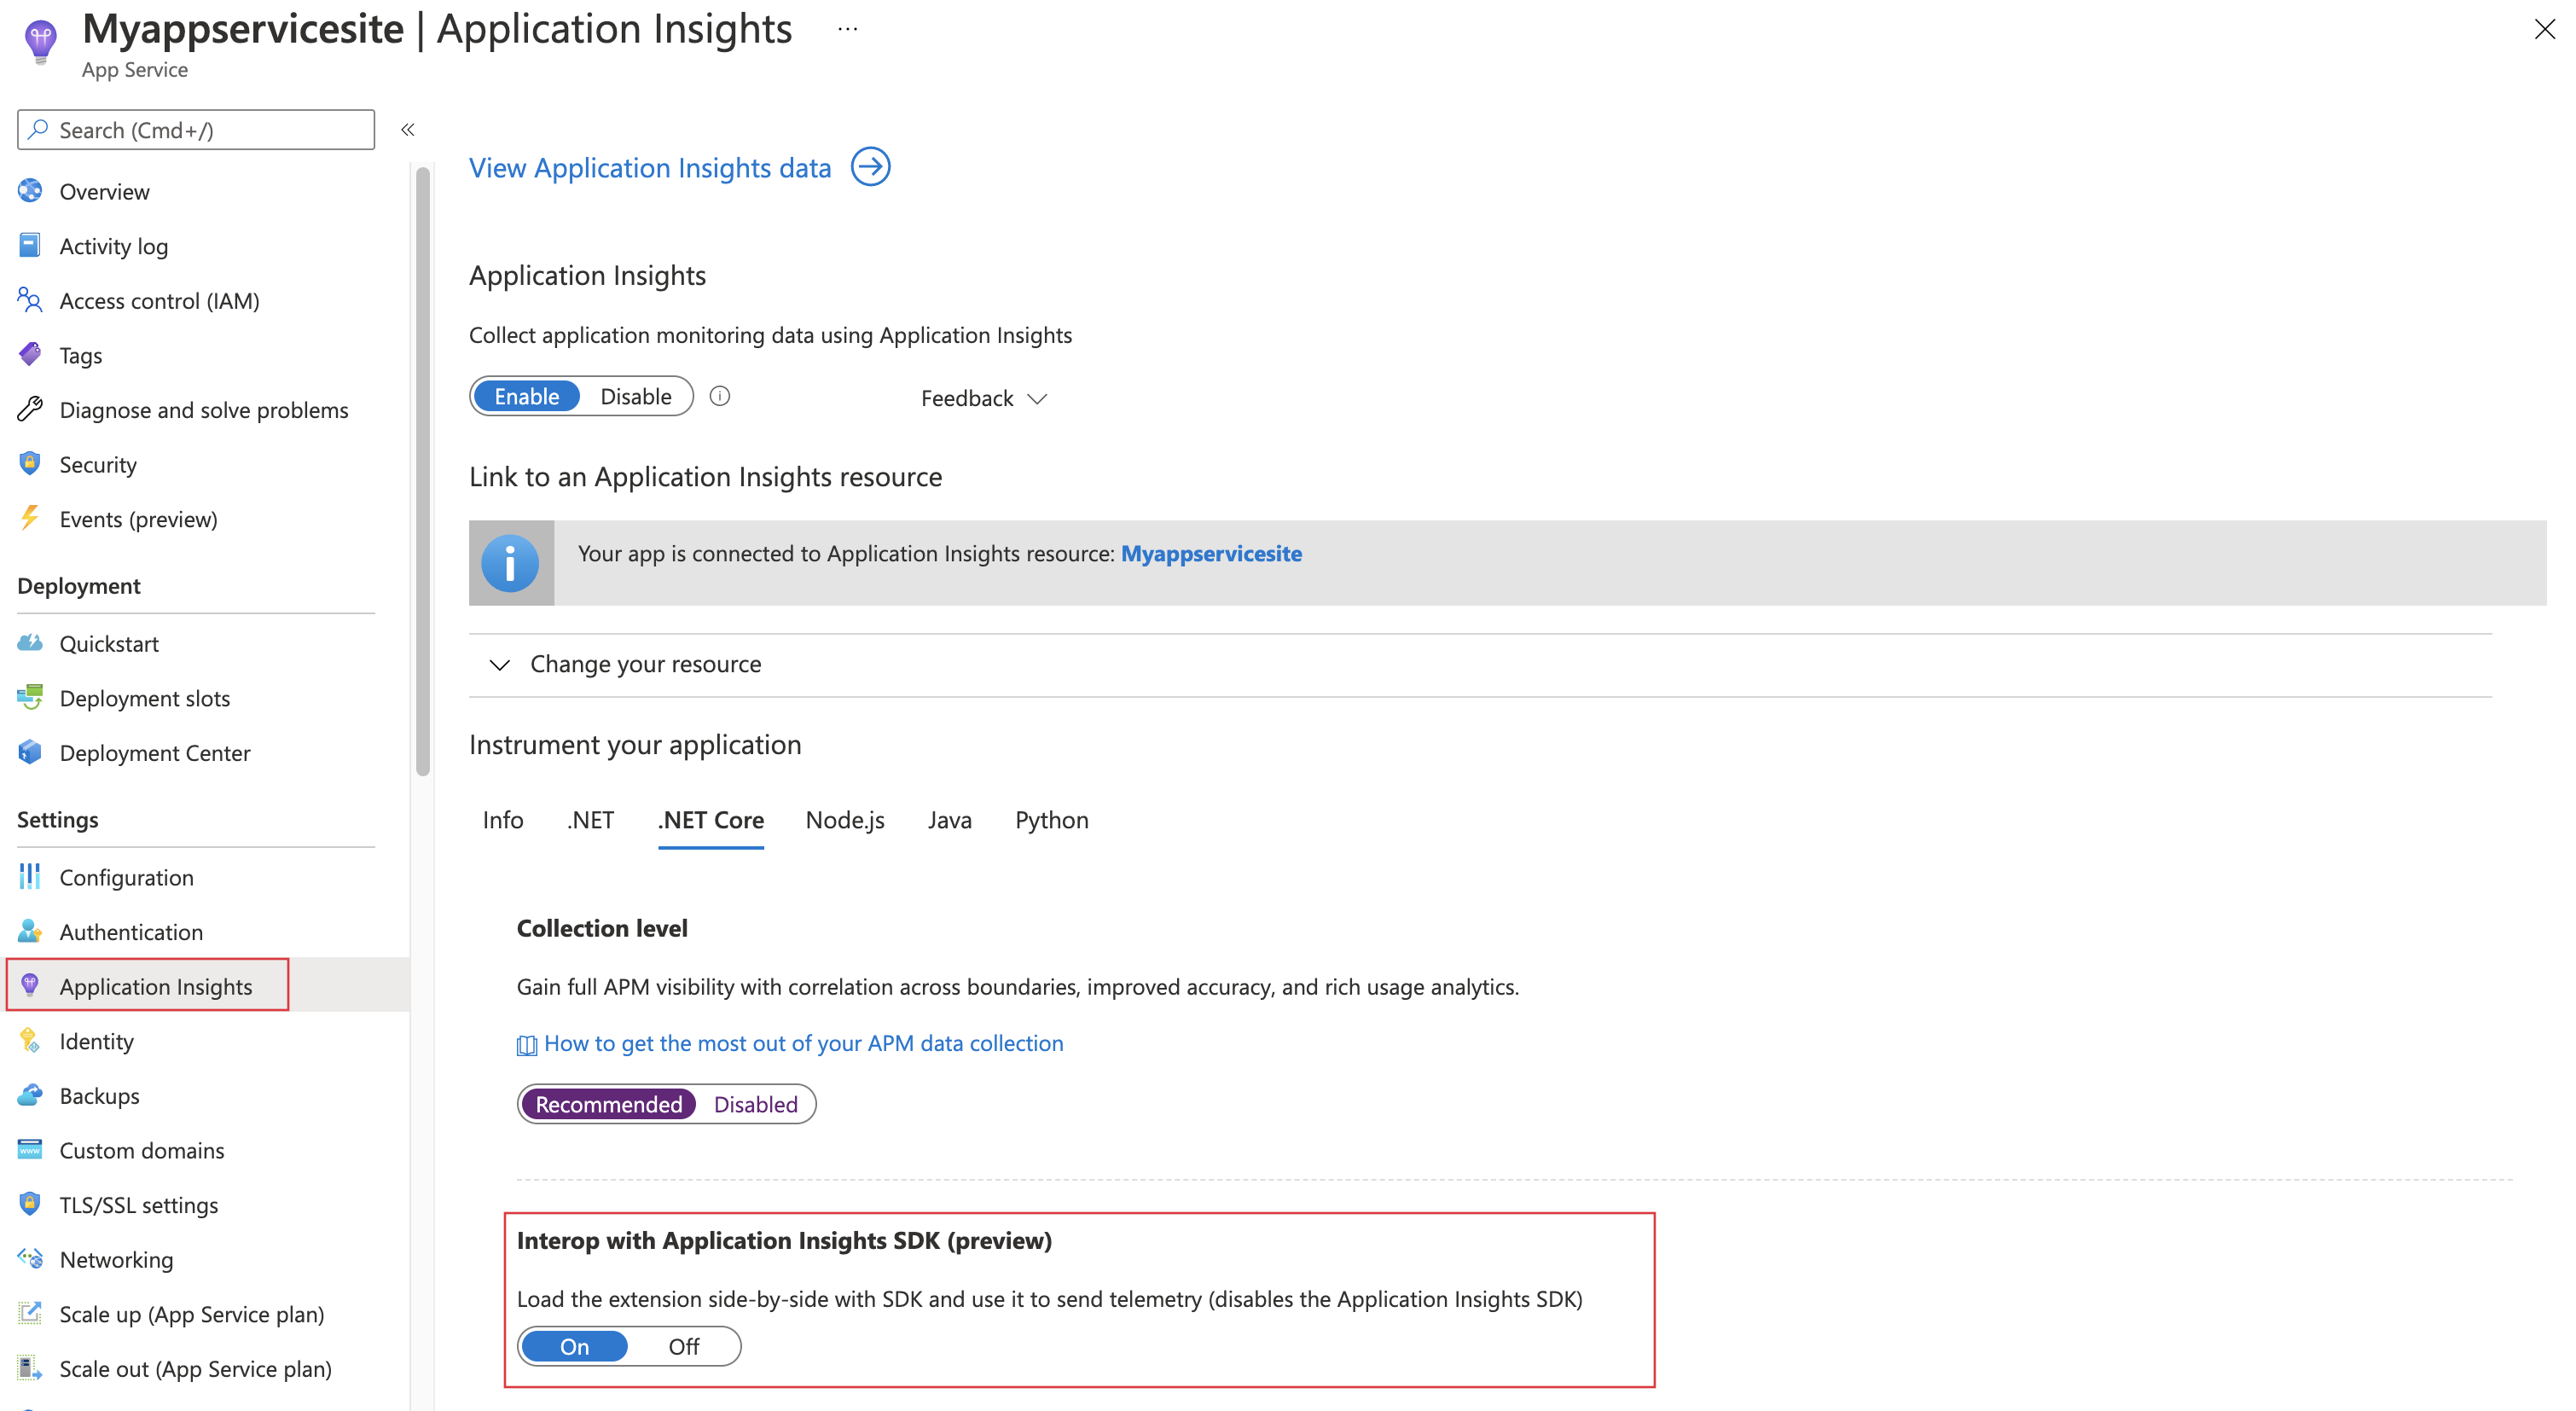
The data is sent using a codeless approach, even if the Application Insights SDK was originally used or attempted to be used.
Important
If the application used the Application Insights SDK to send any telemetry, the telemetry will be disabled. In other words, custom telemetry (for example, any Track*() methods) and custom settings (such as sampling) will be disabled.
Linux
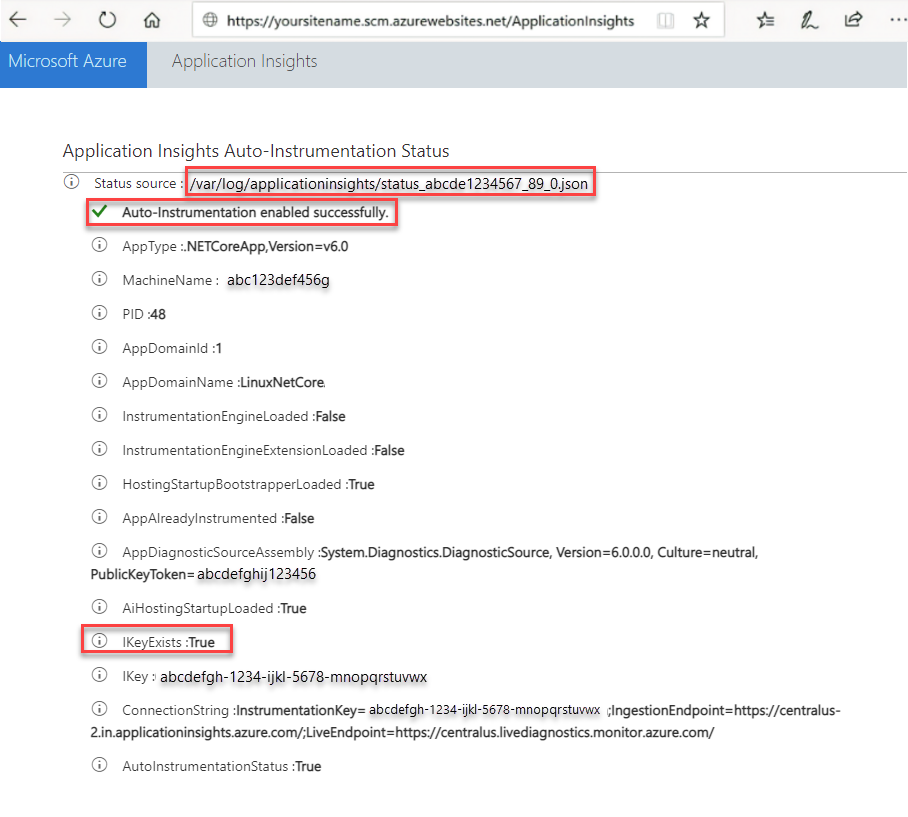
Check that the ApplicationInsightsAgent_EXTENSION_VERSION app setting is set to a value of ~3.
Browse to https://your site name.scm.chinacloudsites.cn/ApplicationInsights.
Within this site, confirm:
- The status source exists and looks like
Status source /var/log/applicationinsights/status_abcde1234567_89_0.json.
- The value
Auto-Instrumentation enabled successfully is displayed. If a similar value isn't present, it means the application isn't running or isn't supported. To ensure that the application is running, try manually visiting the application URL/application endpoints, which allows the runtime information to become available.
- IKeyExists is
True. If it's False, add APPINSIGHTS_INSTRUMENTATIONKEY and APPLICATIONINSIGHTS_CONNECTION_STRING with your ikey GUID to your application settings.
Default website deployed with web apps doesn't support automatic client-side monitoring
When you create a web app with the ASP.NET Core runtimes in App Service, it deploys a single static HTML page as a starter website. The static webpage also loads an ASP.NET-managed web part in IIS. This behavior allows for testing codeless server-side monitoring but doesn't support automatic client-side monitoring.
If you want to test out codeless server and client-side monitoring for ASP.NET Core in an App Service web app, we recommend following the official guides for creating an ASP.NET Core web app. Afterwards, use the instructions in the current article to enable monitoring.
PHP and WordPress aren't supported
PHP and WordPress sites aren't supported. There's currently no officially supported SDK/agent for server-side monitoring of these workloads. To track client-side transactions on a PHP or WordPress site, add the client-side JavaScript to your webpages using the JavaScript SDK.
The following table provides an explanation of what these values mean, their underlying causes, and recommended fixes.
| Problem value |
Explanation |
Fix |
AppAlreadyInstrumented:true |
This value indicates that the extension detected some aspect of the SDK already present in the application and backs off. A reference to Microsoft.ApplicationInsights.AspNetCore or Microsoft.ApplicationInsights can cause this value. |
Remove the references. Some of these references are added by default from certain Visual Studio templates. Older versions of Visual Studio reference Microsoft.ApplicationInsights. |
AppAlreadyInstrumented:true |
The presence of Microsoft.ApplicationsInsights DLL in the app folder from a previous deployment can also cause this value. |
Clean the app folder to ensure that these DLLs are removed. Check both your local app's bin directory and the wwwroot directory on the App Service. (To check the wwwroot directory of your App Service web app, select Advanced Tools (Kudu) > Debug console > CMD > home\site\wwwroot). |
IKeyExists:false |
This value indicates that the instrumentation key isn't present in the app setting APPINSIGHTS_INSTRUMENTATIONKEY. Possible causes include accidentally removing the values or forgetting to set the values in automation script. |
Make sure the setting is present in the App Service application settings. |
Note
When you create a web app with the ASP.NET runtimes in App Service, it deploys a single static HTML page as a starter website. We do not recommend that you troubleshoot an issue with a default template. Deploy an application before you troubleshoot an issue.
Missing telemetry
Check that the ApplicationInsightsAgent_EXTENSION_VERSION app setting is set to a value of ~2.
Browse to https://yoursitename.scm.chinacloudsites.cn/ApplicationInsights.
Confirm that Application Insights Extension Status is Pre-Installed Site Extension, version 2.8.x.xxxx and is running.
If it isn't running, follow the instructions to enable Application Insights monitoring.
Confirm that the status source exists and looks like Status source D:\home\LogFiles\ApplicationInsights\status\status_RD0003FF0317B6_4248_1.json.
If a similar value isn't present, it means the application isn't currently running or isn't supported. To ensure that the application is running, try manually visiting the application URL/application endpoints, which allows the runtime information to become available.
Confirm that IKeyExists is true.
If not, add APPINSIGHTS_INSTRUMENTATIONKEY and APPLICATIONINSIGHTS_CONNECTION_STRING with your instrumentation key GUID to your application settings.
Confirm that there are no entries for AppAlreadyInstrumented, AppContainsDiagnosticSourceAssembly, and AppContainsAspNetTelemetryCorrelationAssembly.
If any of these entries exist, remove the following packages from your application: Microsoft.ApplicationInsights, System.Diagnostics.DiagnosticSource, and Microsoft.AspNet.TelemetryCorrelation.
Default website deployed with web apps doesn't support automatic client-side monitoring
When you create a web app with the ASP.NET runtimes in App Service, it deploys a single static HTML page as a starter website. The static webpage also loads an ASP.NET-managed web part in IIS. This page allows for testing codeless server-side monitoring but doesn't support automatic client-side monitoring.
If you want to test out codeless server and client-side monitoring for ASP.NET in an App Service web app, we recommend following the official guides for creating an ASP.NET Framework web app. Afterwards, use the instructions in the current article to enable monitoring.
APPINSIGHTS_JAVASCRIPT_ENABLED and urlCompression not supported
If you use APPINSIGHTS_JAVASCRIPT_ENABLED=true in cases where content is encoded, you might get errors like:
- 500 URL rewrite error.
- 500.53 URL rewrite module error with the message "Outbound rewrite rules can't be applied when the content of the HTTP response is encoded ('gzip')."
An error occurs because the APPINSIGHTS_JAVASCRIPT_ENABLED application setting is set to true and content encoding is present at the same time. This scenario isn't supported yet. The workaround is to remove APPINSIGHTS_JAVASCRIPT_ENABLED from your application settings. Unfortunately, if client/browser-side JavaScript instrumentation is still required, manual SDK references are needed for your webpages. Follow the instructions for manual instrumentation with the JavaScript SDK.
For the latest information on the Application Insights agent/extension, see the release notes.
PHP and WordPress aren't supported
PHP and WordPress sites aren't supported. There's currently no officially supported SDK/agent for server-side monitoring of these workloads. To track client-side transactions on a PHP or WordPress site, add the client-side JavaScript to your webpages using the JavaScript SDK.
The following table provides an explanation of what these values mean, their underlying causes, and recommended fixes.
| Problem value |
Explanation |
Fix |
AppAlreadyInstrumented:true |
This value indicates that the extension detected some aspect of the SDK already present in the application and backs off. A reference to System.Diagnostics.DiagnosticSource, Microsoft.AspNet.TelemetryCorrelation, or Microsoft.ApplicationInsights can cause this value. |
Remove the references. Some of these references are added by default from certain Visual Studio templates. Older versions of Visual Studio might add references to Microsoft.ApplicationInsights. |
AppAlreadyInstrumented:true |
The presence of the preceding DLLs in the app folder from a previous deployment can also cause this value. |
Clean the app folder to ensure that these DLLs are removed. Check both your local app's bin directory and the wwwroot directory on the App Service resource. To check the wwwroot directory of your App Service web app, select Advanced Tools (Kudu) > Debug console > CMD > home\site\wwwroot. |
AppContainsAspNetTelemetryCorrelationAssembly: true |
This value indicates that the extension detected references to Microsoft.AspNet.TelemetryCorrelation in the application and backs off. |
Remove the reference. |
AppContainsDiagnosticSourceAssembly**:true |
This value indicates that the extension detected references to System.Diagnostics.DiagnosticSource in the application and backs off. |
For ASP.NET, remove the reference. |
IKeyExists:false |
This value indicates that the instrumentation key isn't present in the app setting APPINSIGHTS_INSTRUMENTATIONKEY. Possible causes might be that the values were accidentally removed, or you forgot to set the values in the automation script. |
Make sure the setting is present in the App Service application settings. |
System.IO.FileNotFoundException after 2.8.44 upgrade
The 2.8.44 version of autoinstrumentation upgrades Application Insights SDK to 2.20.0. The Application Insights SDK has an indirect reference to System.Runtime.CompilerServices.Unsafe.dll through System.Diagnostics.DiagnosticSource.dll. If the application has binding redirect for System.Runtime.CompilerServices.Unsafe.dll and if this library isn't present in the application folder, it might throw System.IO.FileNotFoundException.
To resolve this issue, remove the binding redirect entry for System.Runtime.CompilerServices.Unsafe.dll from the web.config file. If the application wanted to use System.Runtime.CompilerServices.Unsafe.dll, set the binding redirect as shown here:
<dependentAssembly>
    <assemblyIdentity name="System.Runtime.CompilerServices.Unsafe" publicKeyToken="b03f5f7f11d50a3a" culture="neutral" />
    <bindingRedirect oldVersion="0.0.0.0-4.0.4.1" newVersion="4.0.4.1" />
</dependentAssembly>
As a temporary workaround, you could set the app setting ApplicationInsightsAgent_EXTENSION_VERSION to a value of 2.8.37. This setting triggers App Service to use the old Application Insights extension. Temporary mitigations should only be used as an interim.
Missing telemetry
Check that ApplicationInsightsAgent_EXTENSION_VERSION app setting is set to a value of ~2 on Windows, ~3 on Linux
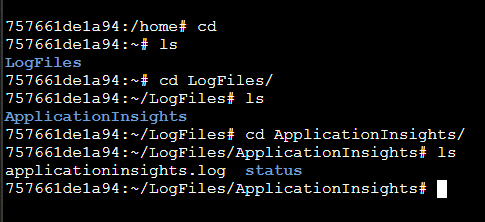
Examine the log file to see that the agent started successfully: browse to https://yoursitename.scm.chinacloudsites.cn/, under SSH change to the root directory, the log file is located under LogFiles/ApplicationInsights.
After enabling application monitoring for your Java app, you can validate that the agent is working by looking at the live metrics - even before you deploy and app to App Service you'll see some requests from the environment. Remember that the full set of telemetry is only available when you have your app deployed and running.
Set APPLICATIONINSIGHTS_SELF_DIAGNOSTICS_LEVEL environment variable to debug if you don't see any errors and there's no telemetry.
Missing telemetry
Windows
Check that ApplicationInsightsAgent_EXTENSION_VERSION app setting is set to a value of ~2.
Browse to https://yoursitename.scm.chinacloudsites.cn/ApplicationInsights.
Confirm that the Application Insights Extension Status is Pre-Installed Site Extension, version 2.8.x.xxxx, is running.
If it isn't running, follow the enable Application Insights monitoring instructions.
Navigate to D:\local\Temp\status.json and open status.json.
Confirm that SDKPresent is set to false, AgentInitializedSuccessfully to true and IKey to have a valid iKey.
Example of the JSON file:
    "AppType":"node.js",

    "MachineName":"c89d3a6d0357",

    "PID":"47",

    "AgentInitializedSuccessfully":true,

    "SDKPresent":false,

    "IKey":"00000000-0000-0000-0000-000000000000",

    "SdkVersion":"1.8.10"
If SDKPresent is true, it means the extension detected that some aspect of the SDK is already present in the Application, and will back-off.
Linux
Check that ApplicationInsightsAgent_EXTENSION_VERSION app setting is set to a value of ~3.
Navigate to /var/log/applicationinsights/ and open status.json.
Confirm that SDKPresent is set to false, AgentInitializedSuccessfully to true and IKey to have a valid iKey.
Example of the JSON file:
    "AppType":"node.js",

    "MachineName":"c89d3a6d0357",

    "PID":"47",

    "AgentInitializedSuccessfully":true,

    "SDKPresent":false,

    "IKey":"00000000-0000-0000-0000-000000000000",

    "SdkVersion":"1.8.10"
If SDKPresent is true, it means the extension detected that some aspect of the SDK is already present in the Application, and will back-off.
Duplicate telemetry
Only use autoinstrumentation on App Service if you aren't using manual instrumentation of OpenTelemetry in your code, such as the Azure Monitor OpenTelemetry Distro or the Azure Monitor OpenTelemetry Exporter.
Using autoinstrumentation on top of the manual instrumentation could cause duplicate telemetry and increase your cost. In order to use App Service OpenTelemetry autoinstrumentation, first remove manual instrumentation of OpenTelemetry from your code.
Missing telemetry
If you're missing telemetry, follow these steps to confirm that autoinstrumentation is enabled correctly.
Confirm that autoinstrumentation is enabled in the Application Insights experience on your App Service resource.
Confirm that the ApplicationInsightsAgent_EXTENSION_VERSION app setting is set to a value of ~3 and that your APPLICATIONINSIGHTS_CONNECTION_STRING points to the appropriate Application Insights resource.
Check autoinstrumentation diagnostics and status logs.
a. Navigate to /var/log/applicationinsights/ and open status_*.json.
b. Confirm that AgentInitializedSuccessfully is set to true and IKey to have a valid iKey.
Example JSON file:
    "AgentInitializedSuccessfully":true,

    "AppType":"python",

    "MachineName":"c89d3a6d0357",

    "PID":"47",

    "IKey":"00000000-0000-0000-0000-000000000000",

    "SdkVersion":"1.0.0"
The applicationinsights-extension.log file in the same folder may show other helpful diagnostics.
Django apps
If your app uses Django and is either failing to start or using incorrect settings, make sure to set the DJANGO_SETTINGS_MODULE environment variable. See the Django Instrumentation section for details.
For the latest updates and bug fixes, consult the release notes.
Next steps


