柱形图
柱形图视觉对象至少需要查询结果中的两列。 默认情况下,第一列用作 x 轴。 此列可以包含文本、日期时间或数值数据类型。 其他列用作 y 轴,包含要显示为垂直线的数值数据类型。 柱形图用于比较主类别范围内的特定子类别项,其中每条线的长度表示其值。
注意
此可视化效果只能在 render 运算符的上下文中使用。
语法
T | render columnchart [with (propertyName = propertyValue [, ...])]
详细了解语法约定。
参数
| 客户 | 类型 | 必需 | 说明 |
|---|---|---|---|
| T | string |
✔️ | 输入表名称。 |
| propertyName, propertyValue | string |
键值属性对的逗号分隔列表。 请参阅支持的属性。 |
支持的属性
所有属性都是可选的。
| PropertyName | PropertyValue |
|---|---|
accumulate |
是否将每个度量的值加到其所有前导度量中。 (true 或 false) |
kind |
可视化效果种类的进一步细化。 有关详细信息,请参阅 kind property。 |
legend |
是否显示图例(visible 或 hidden)。 |
series |
以逗号分隔的列列表,其中的每记录值组合定义了记录所属的系列。 |
ymin |
要在 Y 轴上显示的最小值。 |
ymax |
要在 Y 轴上显示的最大值。 |
title |
可视化效果的标题(string 类型)。 |
xaxis |
如何缩放 x 轴(linear 或 log)。 |
xcolumn |
结果中的哪一列用于 x 轴。 |
xtitle |
x 轴的标题(string 类型)。 |
yaxis |
如何缩放 y 轴(linear 或 log)。 |
ycolumns |
由逗号分隔的列列表,其中包含根据 x 列的值提供的值。 |
ytitle |
y 轴的标题(string 类型)。 |
ysplit |
如何将可视化效果拆分为多个 y 轴值。 有关详细信息,请参阅 ysplit property。 |
ysplit 属性
此可视化效果支持拆分为多个 y 轴值:
ysplit |
描述 |
|---|---|
none |
为所有系列数据显示单个 y 轴。 这是默认值。 |
axes |
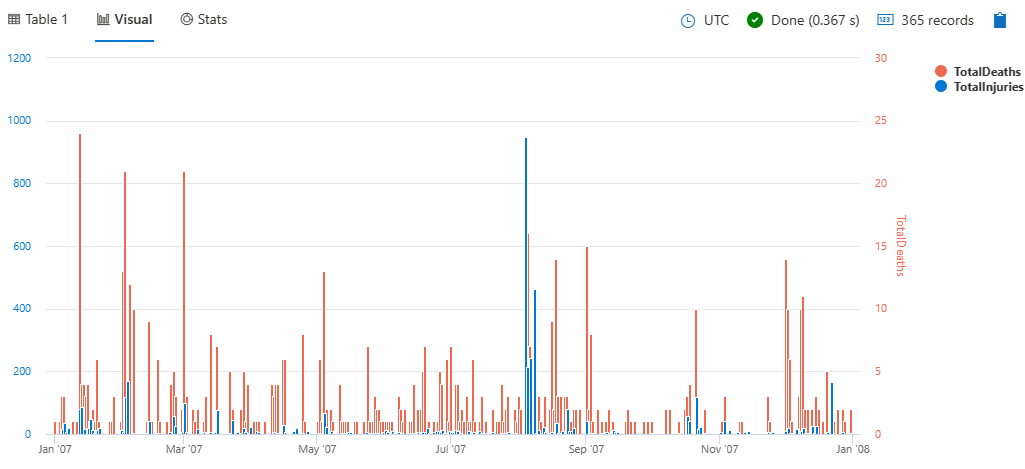
单个图表将显示多个 y 轴(每个系列一个)。 |
panels |
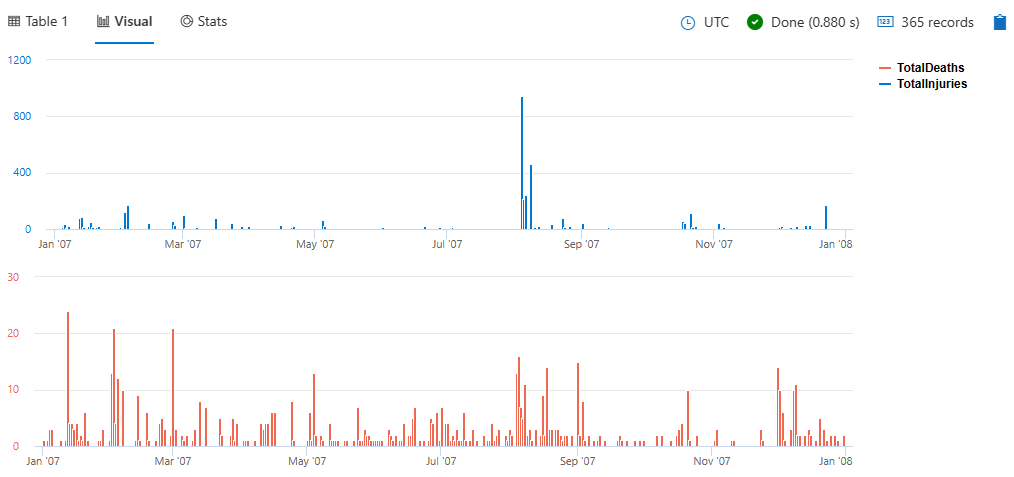
对于每个 ycolumn 值,均会呈现一个图表。 |
支持的属性
所有属性都是可选的。
| PropertyName | PropertyValue |
|---|---|
kind |
可视化效果种类的进一步细化。 有关详细信息,请参阅 kind property。 |
series |
以逗号分隔的列列表,其中的每记录值组合定义了记录所属的系列。 |
title |
可视化效果的标题(string 类型)。 |
kind 属性
可以通过提供 kind 属性来进一步详细阐述此可视化效果。
此属性支持的值为:
kind 值 |
定义 |
|---|---|
default |
每个“柱形”都独立存在。 |
unstacked |
与 default 相同。 |
stacked |
将“柱形”一个接一个地堆叠。 |
stacked100 |
对“柱形”进行堆叠,并将每个柱形拉伸到与其他柱形相同的高度。 |
示例
呈现柱形图
StormEvents
| summarize event_count=count() by State
| where event_count > 10
| project State, event_count
| render columnchart
使用 ysplit 属性
StormEvents
| summarize
    TotalInjuries = sum(InjuriesDirect) + sum(InjuriesIndirect),
    TotalDeaths = sum(DeathsDirect) + sum(DeathsIndirect)
    by bin(StartTime, 1d)
| project StartTime, TotalInjuries, TotalDeaths
| render columnchart with (ysplit=axes)
若要将视图拆分为单独的面板,请指定 panels 而不是 axes:
StormEvents
| summarize
    TotalInjuries = sum(InjuriesDirect) + sum(InjuriesIndirect),
    TotalDeaths = sum(DeathsDirect) + sum(DeathsIndirect)
    by bin(StartTime, 1d)
| project StartTime, TotalInjuries, TotalDeaths
| render columnchart with (ysplit=panels)
示例
StormEvents
| summarize event_count=count() by State
| where event_count > 10
| project State, event_count
| render columnchart


