Note
Access to this page requires authorization. You can try signing in or changing directories.
Access to this page requires authorization. You can try changing directories.
Azure Monitor is one solution offered by Flash. Flash is the internal name for a project dedicated to building a robust, reliable, and rapid mechanism for customers to monitor virtual machine (VM) health.
This article covers the use of the Azure Monitor VM availability metric to monitor Azure Virtual Machine availability. For a general overview of Flash solutions, see the Flash overview.
For documentation specific to the other solutions offered by Flash, choose from the following articles:
Azure monitor - VM availability metric
Currently in public preview. The VM availability metric is well-suited for tracking trends, aggregating platform metrics (such as CPU and disk usage), and configuring precise threshold-based alerts. Customers can utilize this out-of-the-box VM availability metric in Azure Monitor. This metric displays the trend of VM availability over time, so users can:
- Set up threshold-based metric alerts on dipping VM availability to quickly trigger appropriate mitigation actions.
- Correlate the VM availability metric with existing platform metrics like memory, network, or disk for deeper insights into concerning changes that impact the overall performance of workloads.
- Easily interact with and chart metric data during any relevant time window on Metrics Explorer, for quick and easy debugging.
- Route metrics to downstream tooling like Grafana dashboards, for constructing custom visualizations and dashboards.
Get started
Users can either consume the metric programmatically via the Azure Monitor REST API or directly from the Azure portal. The following steps highlight metric consumption from the Azure portal.
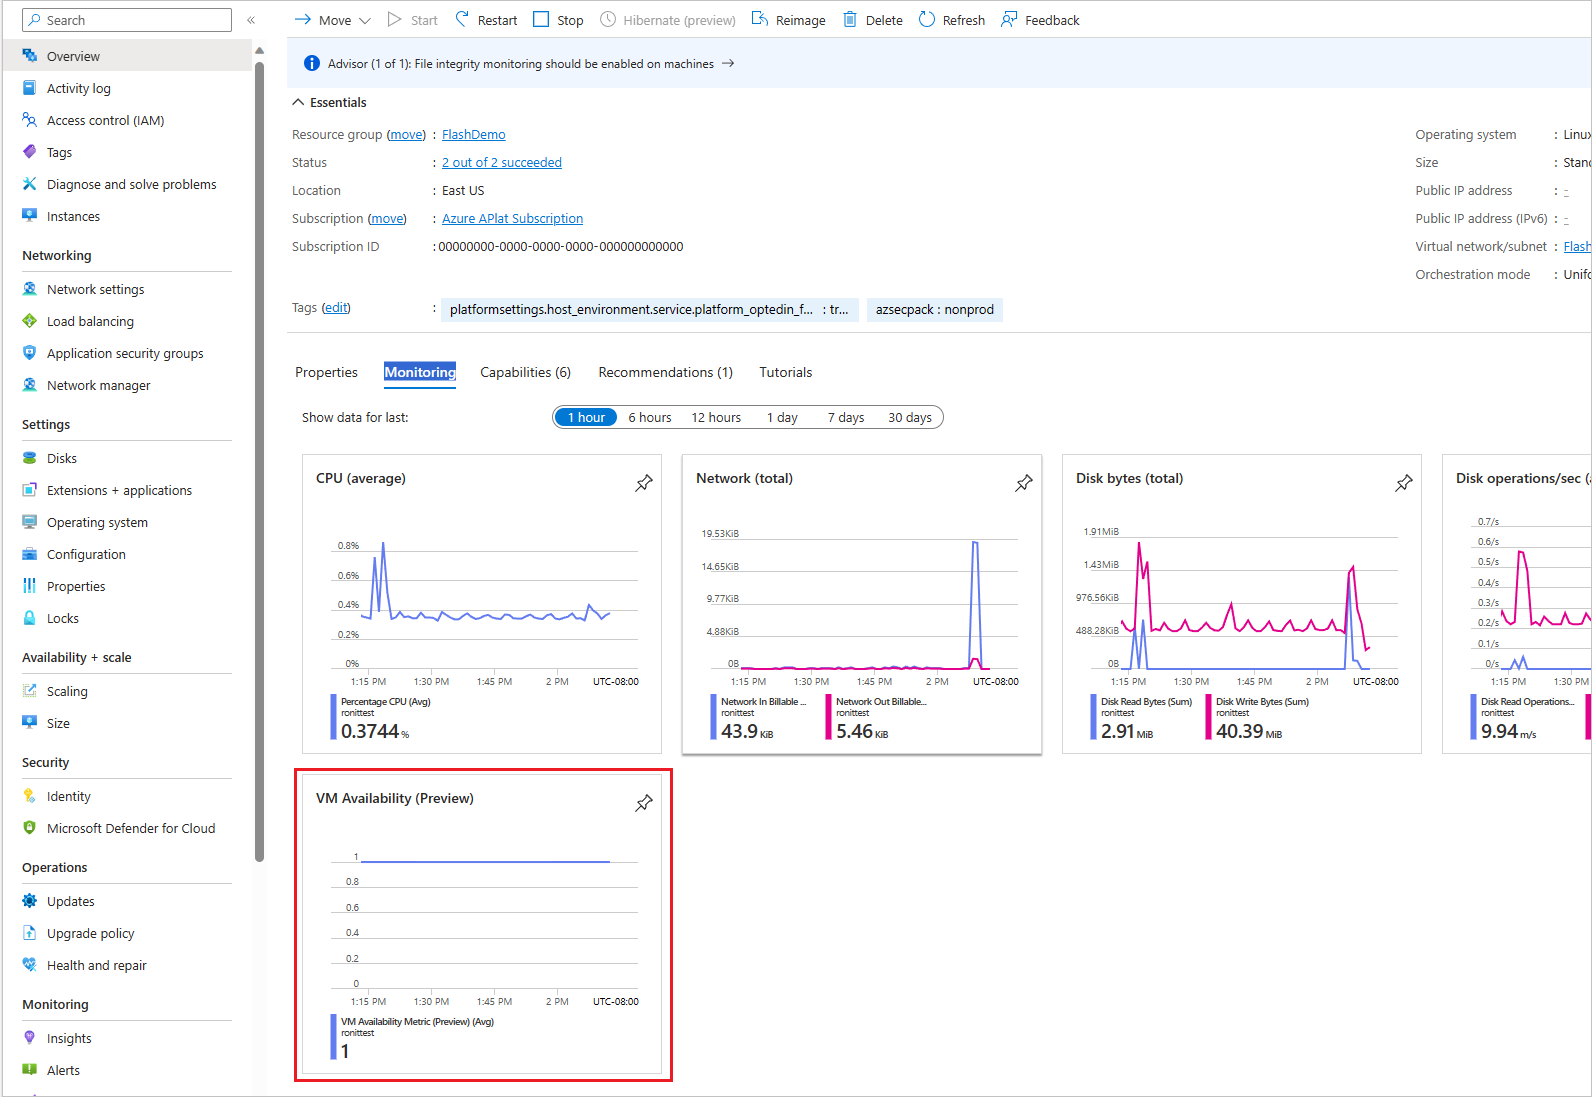
Once on the Azure portal, navigate to the VM overview blade. The new metric is displayed as VM Availability (Preview), along with other platform metrics under the Monitoring tab.
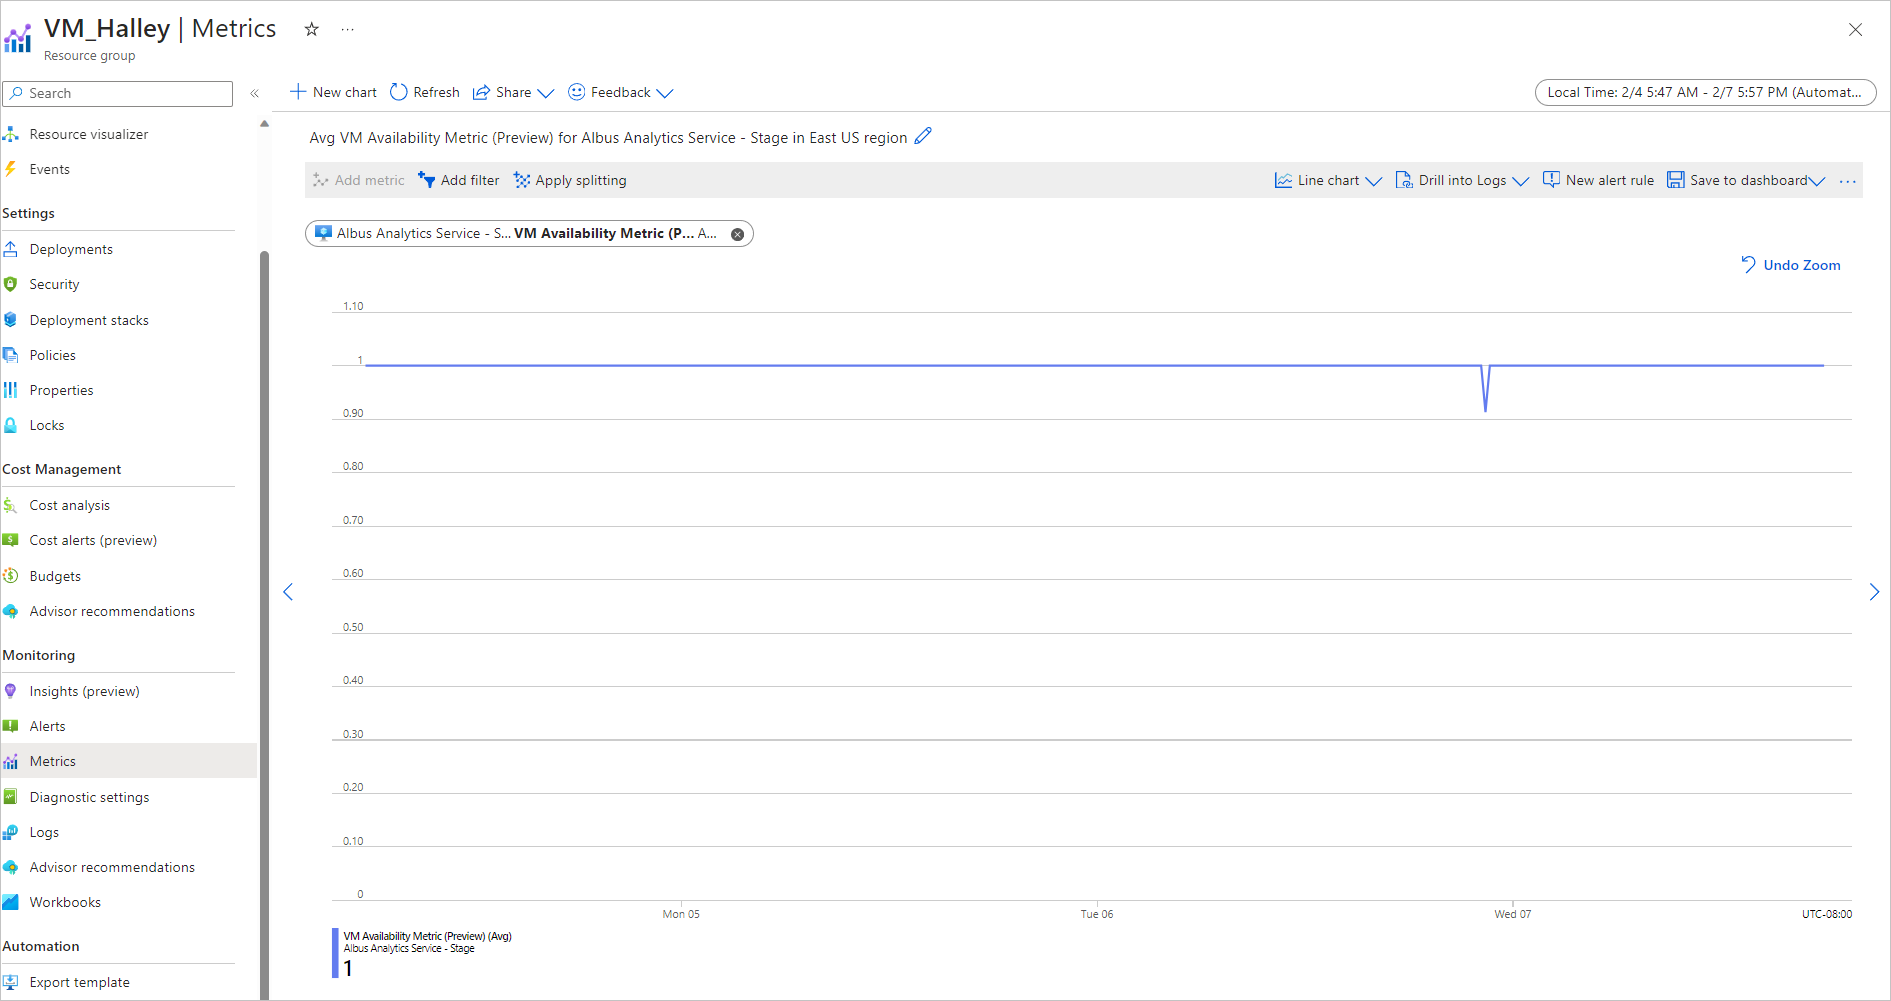
To navigate to the metrics explorer for further analysis, select the VM availability metric chart on the overview page.
For a description of the metric's display values, see VM availability metric.
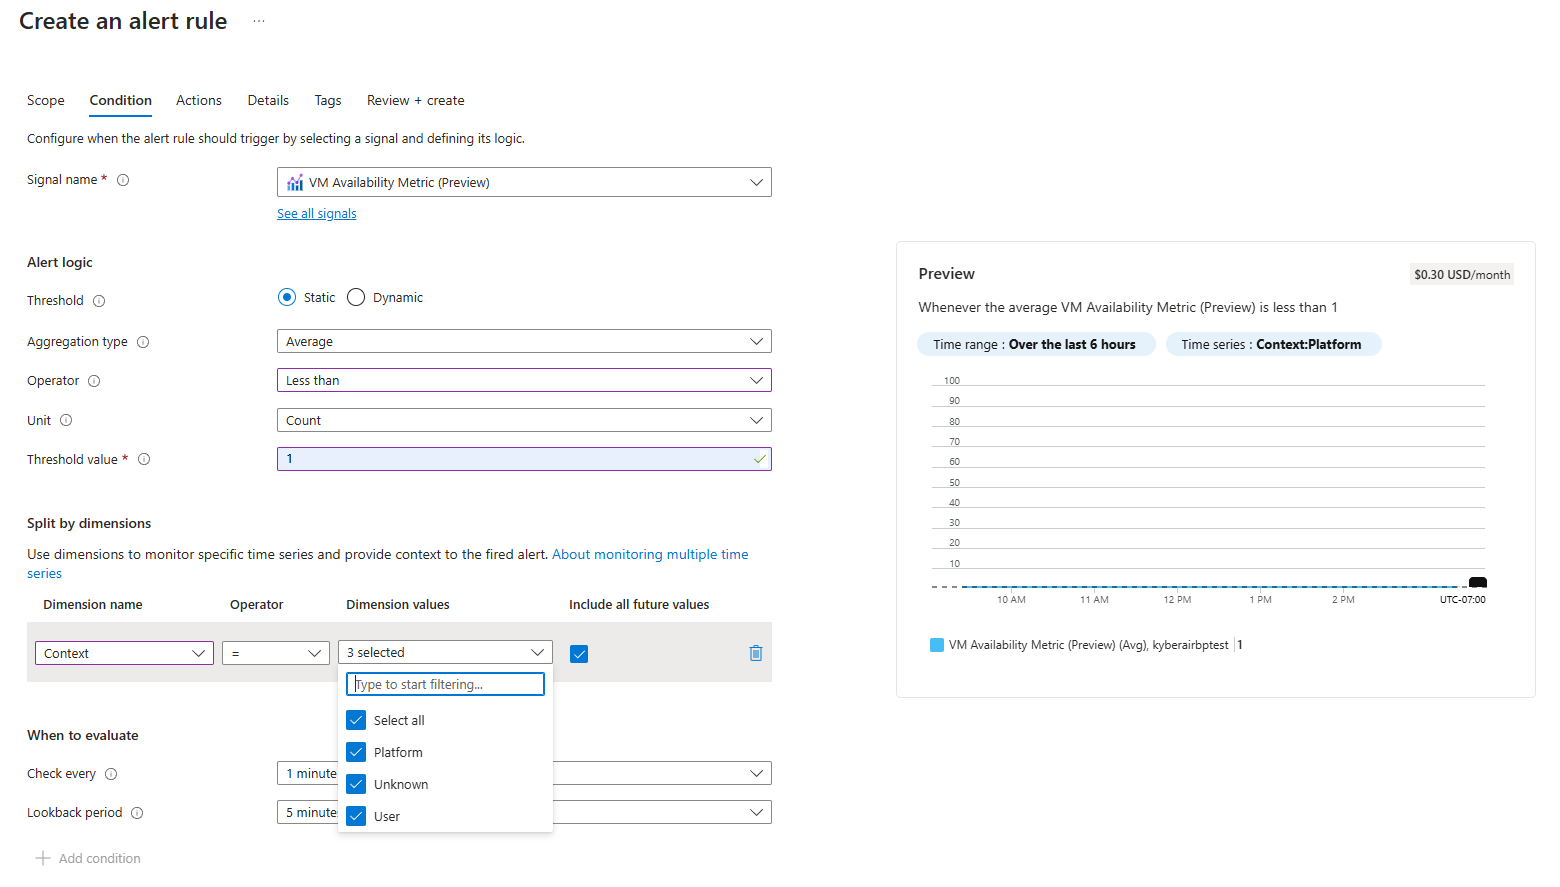
Users can split the VM availability by the 'Context' property.

Note
The context for Service Healing and Live Migration is currently unknown by default.
Users can create an alert rule based on dimension values. Under the Condition tab, choose VM Availability Metric as the Signal name. In the Split by dimensions section, enter Context as the dimension name and select the corresponding dimension values.

Useful links
- How to filter events for Azure Event Grid - Azure Event Grid | Microsoft Learn
- Event filtering for Azure Event Grid - Azure Event Grid | Microsoft Learn
Next steps
To learn more about the solutions offered, proceed to corresponding solution article:
For a general overview of how to monitor Azure Virtual Machines, see Monitor Azure virtual machines and the Monitoring Azure virtual machines reference.

