Note
Access to this page requires authorization. You can try signing in or changing directories.
Access to this page requires authorization. You can try changing directories.
This tutorial shows you how to analyze phone call data using Azure Stream Analytics. The phone call data, generated by a client application, contains fraudulent calls, which are detected by the Stream Analytics job. You can use techniques from this tutorial for other types of fraud detection, such as credit card fraud or identity theft.
In this tutorial, you perform the following tasks:
- Generate sample phone call data and send it to Azure Event Hubs.
- Create a Stream Analytics job.
- Configure job input and output.
- Define queries to filter fraudulent calls.
- Test and start the job.
- Visualize results in Power BI.
Prerequisites
Before you start, make sure you've completed the following steps:
- If you don't have an Azure subscription, create a Trial.
- Download the phone call event generator app, TelcoGenerator.zip from the Microsoft Download Center or get the source code from GitHub.
- You need a Power BI account.
Sign in to Azure
Sign in to the Azure portal.
Create an event hub
You need to send some sample data to an event hub before Stream Analytics can analyze the fraudulent calls data stream. In this tutorial, you send data to Azure by using Azure Event Hubs.
Use the following steps to create an event hub and send call data to that event hub:
Sign in to the Azure portal.
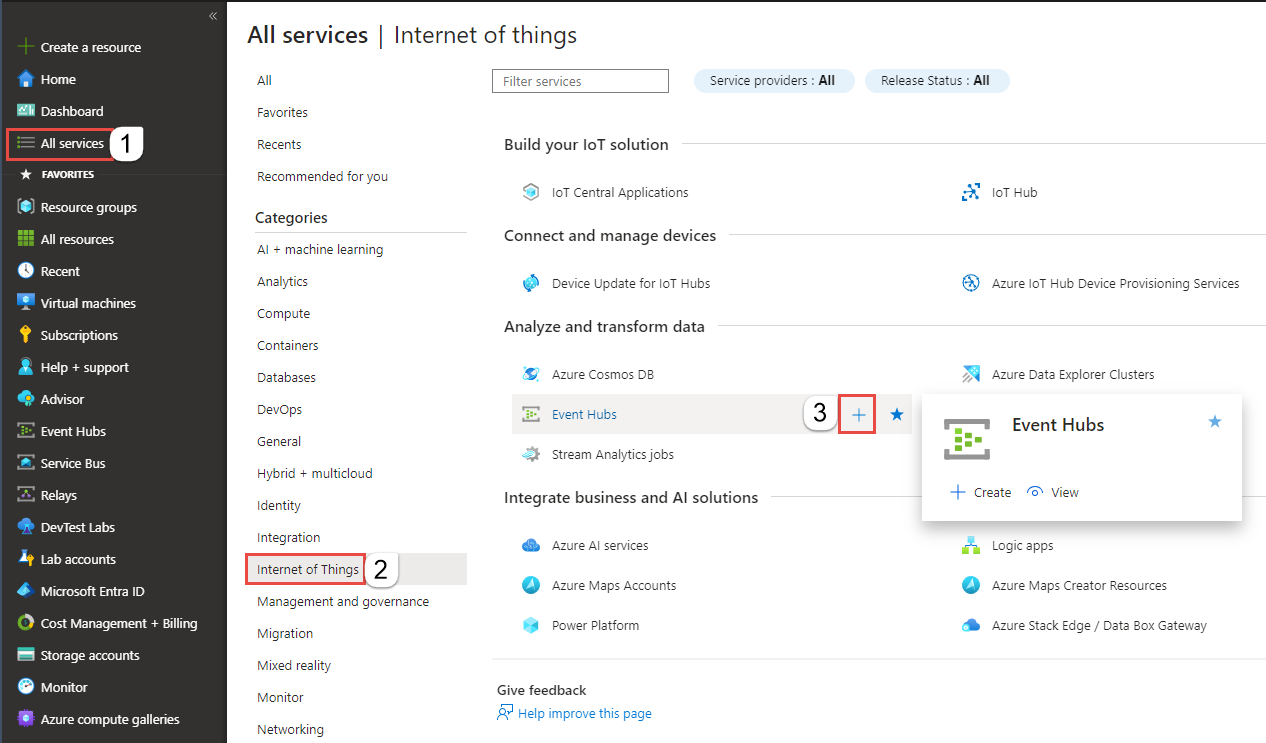
Select All services on the left menu, select Internet of things, mouse the mouse over Event Hubs, and then select + (Add) button.
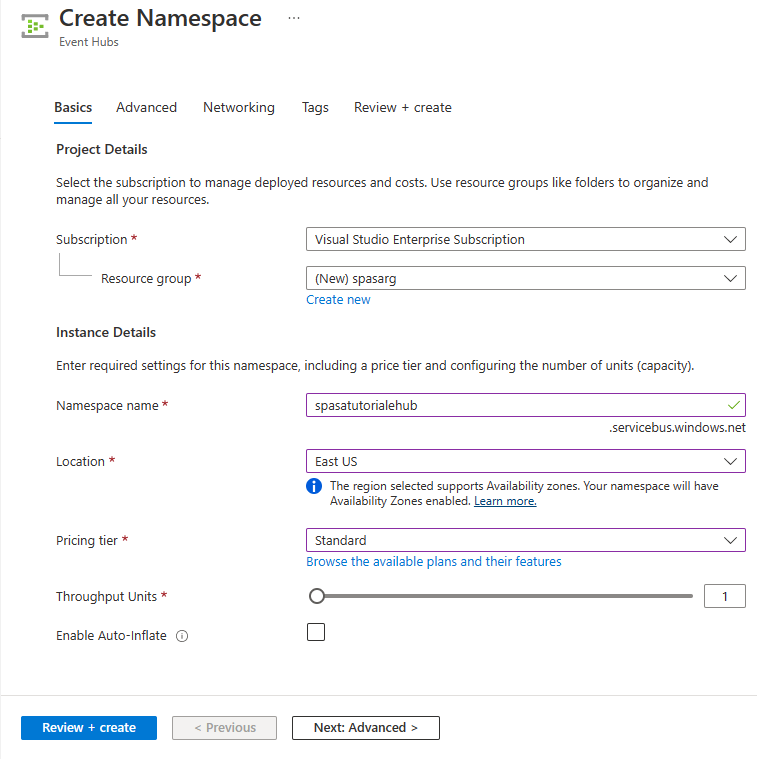
On the Create Namespace page, follow these steps:
Select an Azure subscription where you want to create the event hub.
For Resource group, select Create new and enter a name for the resource group. The Event Hubs namespace is created in this resource group.
For Namespace name, enter a unique name for the Event Hubs namespace.
For Location, select the region in which you want to create the namespace.
For Pricing tier, select Standard.
Select Review + create at the bottom of the page.
On the Review + create page of the namespace creation wizard, select Create at the bottom of the page after reviewing all settings.
After the namespace is deployed successfully, select Go to resource to navigate to the Event Hubs Namespace page.
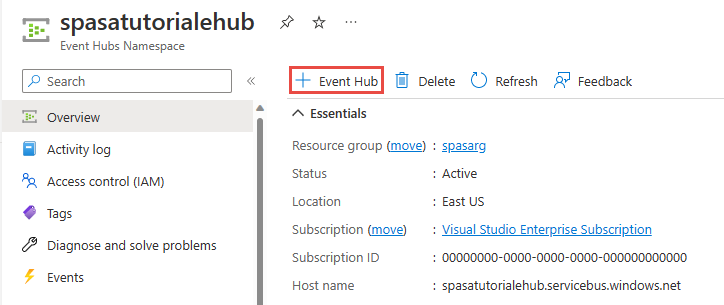
On the Event Hubs Namespace page, select +Event Hub on the command bar.
On the Create Event Hub page, enter a Name for the event hub. Set the Partition Count to 2. Use the default options in the remaining settings and select Review + create.
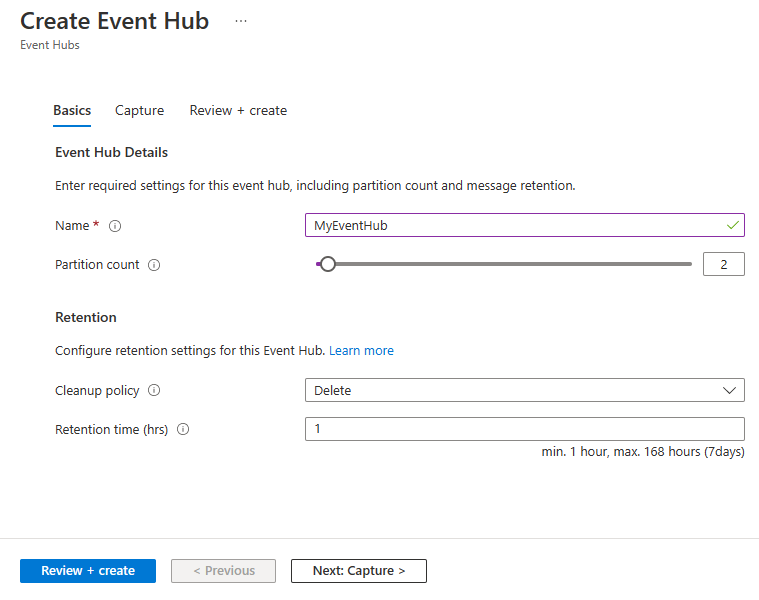
On the Review + create page, select Create at the bottom of the page. Then wait for the deployment to succeed.
Grant access to the event hub and get a connection string
Before an application can send data to Azure Event Hubs, the event hub must have a policy that allows access. The access policy produces a connection string that includes authorization information.
On the Event Hubs Namespace page, select Shared access policies on the left menu.
Select RootManageSharedAccessKey from the list of policies.
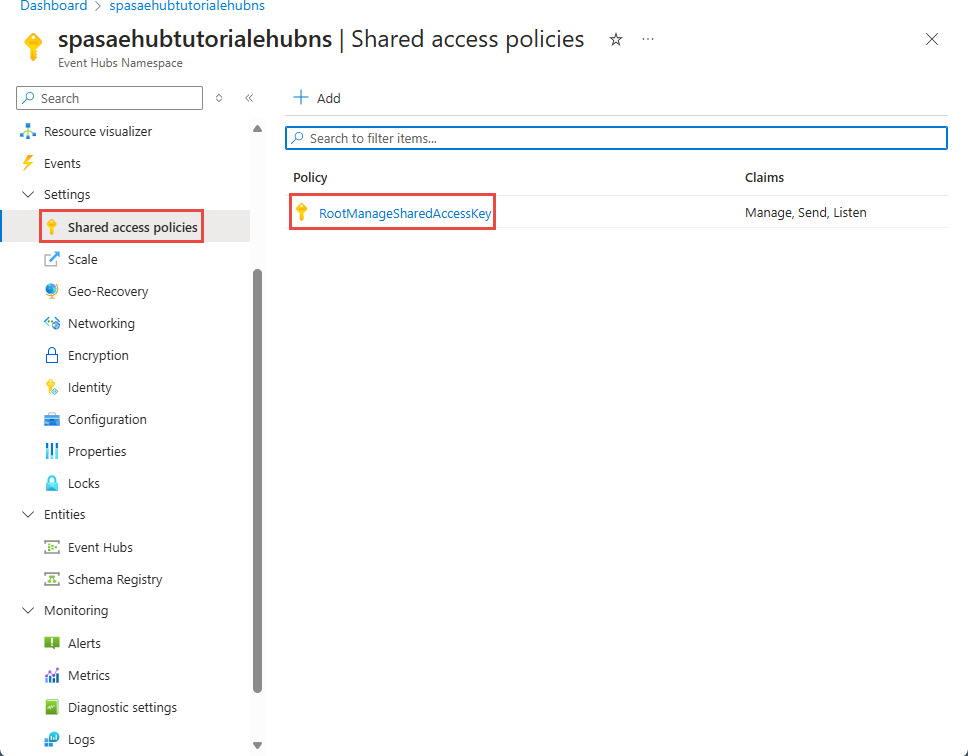
Then, select the copy button next to Connection string - primary key.
Paste the connection string into a text editor. You need this connection string in the next section.
The connection string looks as follows:
Endpoint=sb://<Your event hub namespace>.servicebus.chinacloudapi.cn/;SharedAccessKeyName=<Your shared access policy name>;SharedAccessKey=<generated key>Notice that the connection string contains multiple key-value pairs separated with semicolons: Endpoint, SharedAccessKeyName, and SharedAccessKey.
Start the event generator application
Before you start the TelcoGenerator app, you should configure it to send data to the Azure Event Hubs you created earlier.
Extract the contents of TelcoGenerator.zip file.
Open the
TelcoGenerator\TelcoGenerator\telcodatagen.exe.configfile in a text editor of your choice There's more than one.configfile, so be sure that you open the correct one.Update the
<appSettings>element in the config file with the following details:- Set the value of the EventHubName key to the value of the EntityPath at the end of the connection string.
- Set the value of the Microsoft.ServiceBus.ConnectionString key to the connection string to the namespace. If you use a connection string to an event hub, not a namespace, remove
EntityPathvalue (;EntityPath=myeventhub) at the end. Don't forget to remove the semicolon that precedes the EntityPath value.
Save the file.
Next open a command window and change to the folder where you unzipped the TelcoGenerator application. Then enter the following command:
.\telcodatagen.exe 1000 0.2 2This command takes the following parameters:
- Number of call data records per hour.
- Percentage of fraud probability, which is how often the app should simulate a fraudulent call. The value 0.2 means that about 20% of the call records look fraudulent.
- Duration in hours, which is the number of hours that the app should run. You can also stop the app at any time by ending the process (Ctrl+C) at the command line.
After a few seconds, the app starts displaying phone call records on the screen as it sends them to the event hub. The phone call data contains the following fields:
Record Definition CallrecTime The timestamp for the call start time. SwitchNum The telephone switch used to connect the call. For this example, the switches are strings that represent the country/region of origin (US, China, UK, Germany, or Australia). CallingNum The phone number of the caller. CallingIMSI The International Mobile Subscriber Identity (IMSI). It's a unique identifier of the caller. CalledNum The phone number of the call recipient. CalledIMSI International Mobile Subscriber Identity (IMSI). It's a unique identifier of the call recipient.
Create a Stream Analytics job
Now that you have a stream of call events, you can create a Stream Analytics job that reads data from the event hub.
- To create a Stream Analytics job, navigate to the Azure portal.
- Select Create a resource and search for Stream Analytics job. Select the Stream Analytics job tile and select Create.
- On the New Stream Analytics job page, follow these steps:
For Subscription, select the subscription that contains the Event Hubs namespace.
For Resource group, select the resource group you created earlier.
In the Instance details section, For Name, enter a unique name for the Stream Analytics job.
For Region, select the region in which you want to create the Stream Analytics job. We recommend that you place the job and the event hub in the same region for best performance and so that you don't pay to transfer data between regions.
For Hosting environment< select Cloud if it's not already selected. Stream Analytics jobs can be deployed to cloud or edge. Cloud allows you to deploy to Azure Cloud, and Edge allows you to deploy to an IoT Edge device.
For Streaming units, select 1. Streaming units represent the computing resources that are required to execute a job. By default, this value is set to 1. To learn about scaling streaming units, see understanding and adjusting streaming units article.
Select Review + create at the bottom of the page.
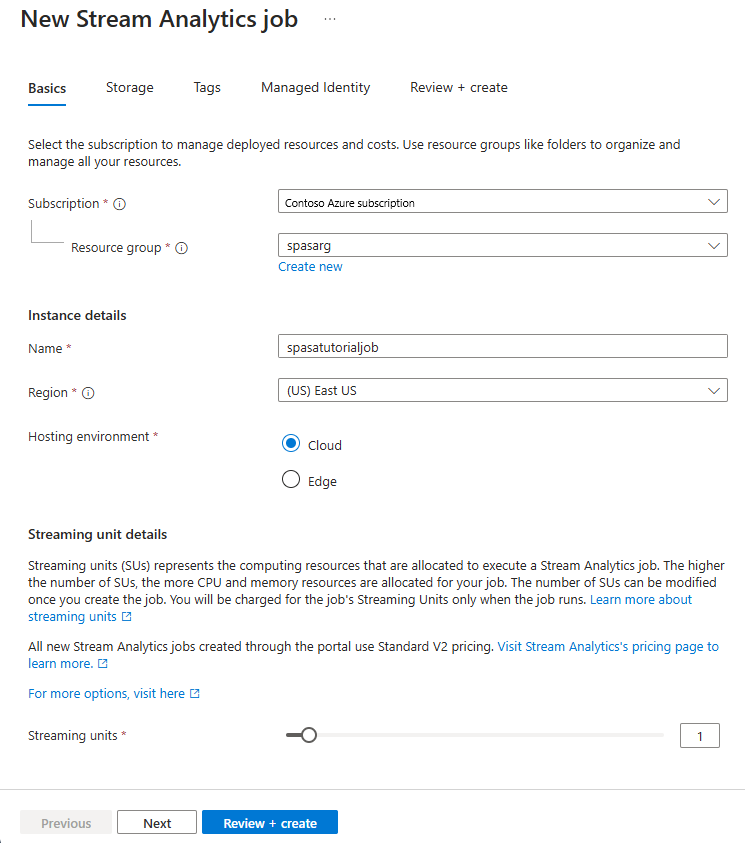
- On the Review + create page, review settings, and then select Create to create the Stream Analytics job.
- After the job is deployed, select Go to resource to navigate to the Stream Analytics job page.
Configure job input
The next step is to define an input source for the job to read data using the event hub you created in the previous section.
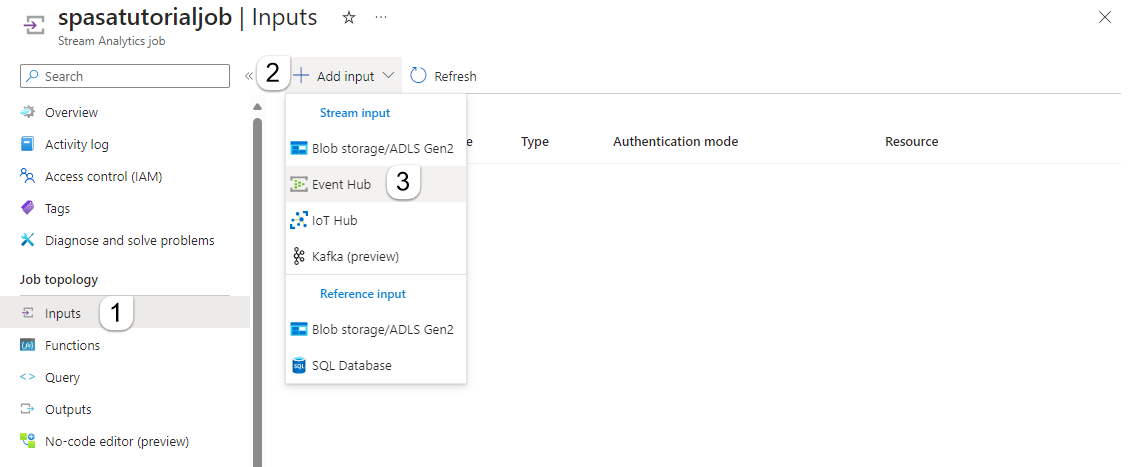
On the Stream Analytics job page, in the Job Topology section on the left menu, select Inputs.
On the Inputs page, select + Add input and Event hub.
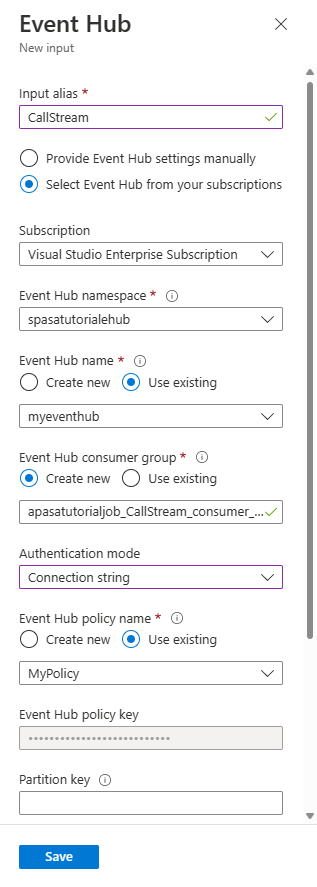
On the Event hub page, follow these steps:
For Input alias, enter CallStream. Input alias is a friendly name to identify your input. Input alias can only contain alphanumeric characters and hyphens, and must be 3-63 characters long.
For Subscription, select the Azure subscription where you created the event hub. The event hub can be in same or a different subscription as the Stream Analytics job.
For Event Hubs namespace, select the Event Hubs namespace you created in the previous section. All the namespaces available in your current subscription are listed in the dropdown.
For Event hub name, select the event hub you created in the previous section. All the event hubs available in the selected namespace are listed in the dropdown.
For Event hub consumer group, keep the Create new option selected so that a new consumer group is created on the event hub. We recommend that you use a distinct consumer group for each Stream Analytics job. If no consumer group is specified, the Stream Analytics job uses the
$Defaultconsumer group. When a job contains a self-join or has multiple inputs, some inputs later might be read by more than one reader. This situation affects the number of readers in a single consumer group.For Authentication mode, select Connection string. It's easier to test the tutorial with this option.
For Event hub policy name, select Use existing, and then select the policy you created earlier.
Select Save at the bottom of the page.
Configure job output
The last step is to define an output sink where the job can write the transformed data. In this tutorial, you output and visualize data with Power BI.
From the Azure portal, open All resources, and select the ASATutorial Stream Analytics job.
In the Job Topology section of the Stream Analytics job, select the Outputs option.
Select + Add output > Power BI.
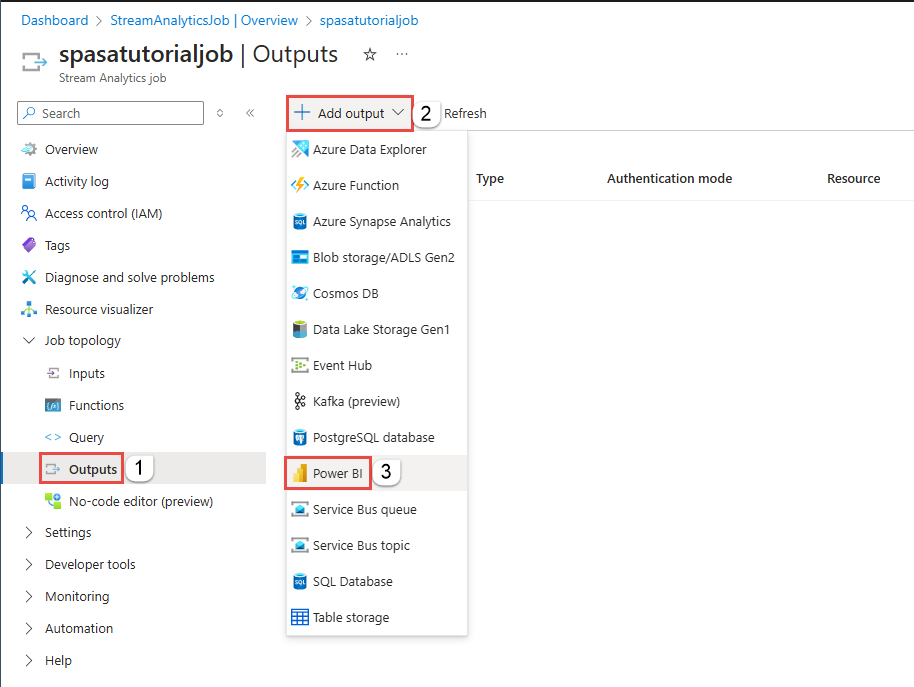
Fill the output form with the following details:
Setting Suggested value Output alias MyPBIoutput Group workspace My workspace Dataset name ASAdataset Table name ASATable Authentication mode User token Select Authorize and follow the prompts to authenticate Power BI.
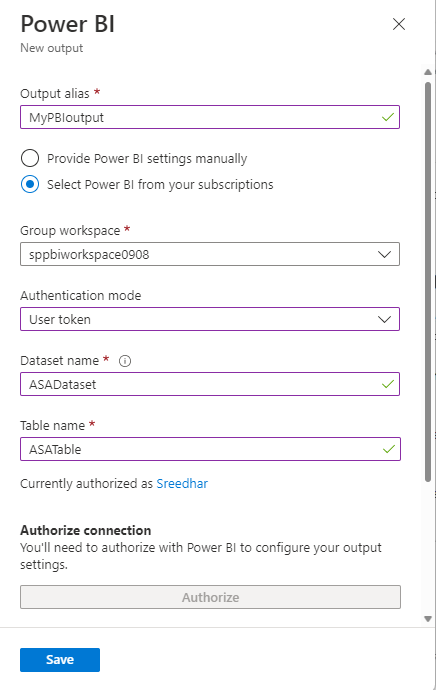
Select Save at the bottom of the Power BI page.
This tutorial uses the User token authentication mode.
Create queries to transform real-time data
At this point, you have a Stream Analytics job set up to read an incoming data stream. The next step is to create a query that analyzes the data in real time. The queries use a SQL-like language that has some extensions specific to Stream Analytics.
In this section of the tutorial, you create and test several queries to learn a few ways in which you can transform an input stream for analysis.
The queries you create here will just display the transformed data to the screen. In a later section, you'll write the transformed data to Power BI.
To learn more about the language, see the Azure Stream Analytics Query Language Reference.
Test using a pass-through query
If you want to archive every event, you can use a pass-through query to read all the fields in the payload of the event.
Navigate to your Stream Analytics job in the Azure portal and select Query under Job topology on the left menu.
In the query window, enter this query:
SELECT
    *
FROM
    CallStream
Note
As with SQL, keywords are not case-sensitive, and whitespace is not significant.
In this query,
CallStreamis the alias that you specified when you created the input. If you used a different alias, use that name instead.Select Test query.
The Stream Analytics job runs the query against the sample data from the input and displays the output at the bottom of the window. The results indicate that the Event Hubs and the Streaming Analytics job are configured correctly.
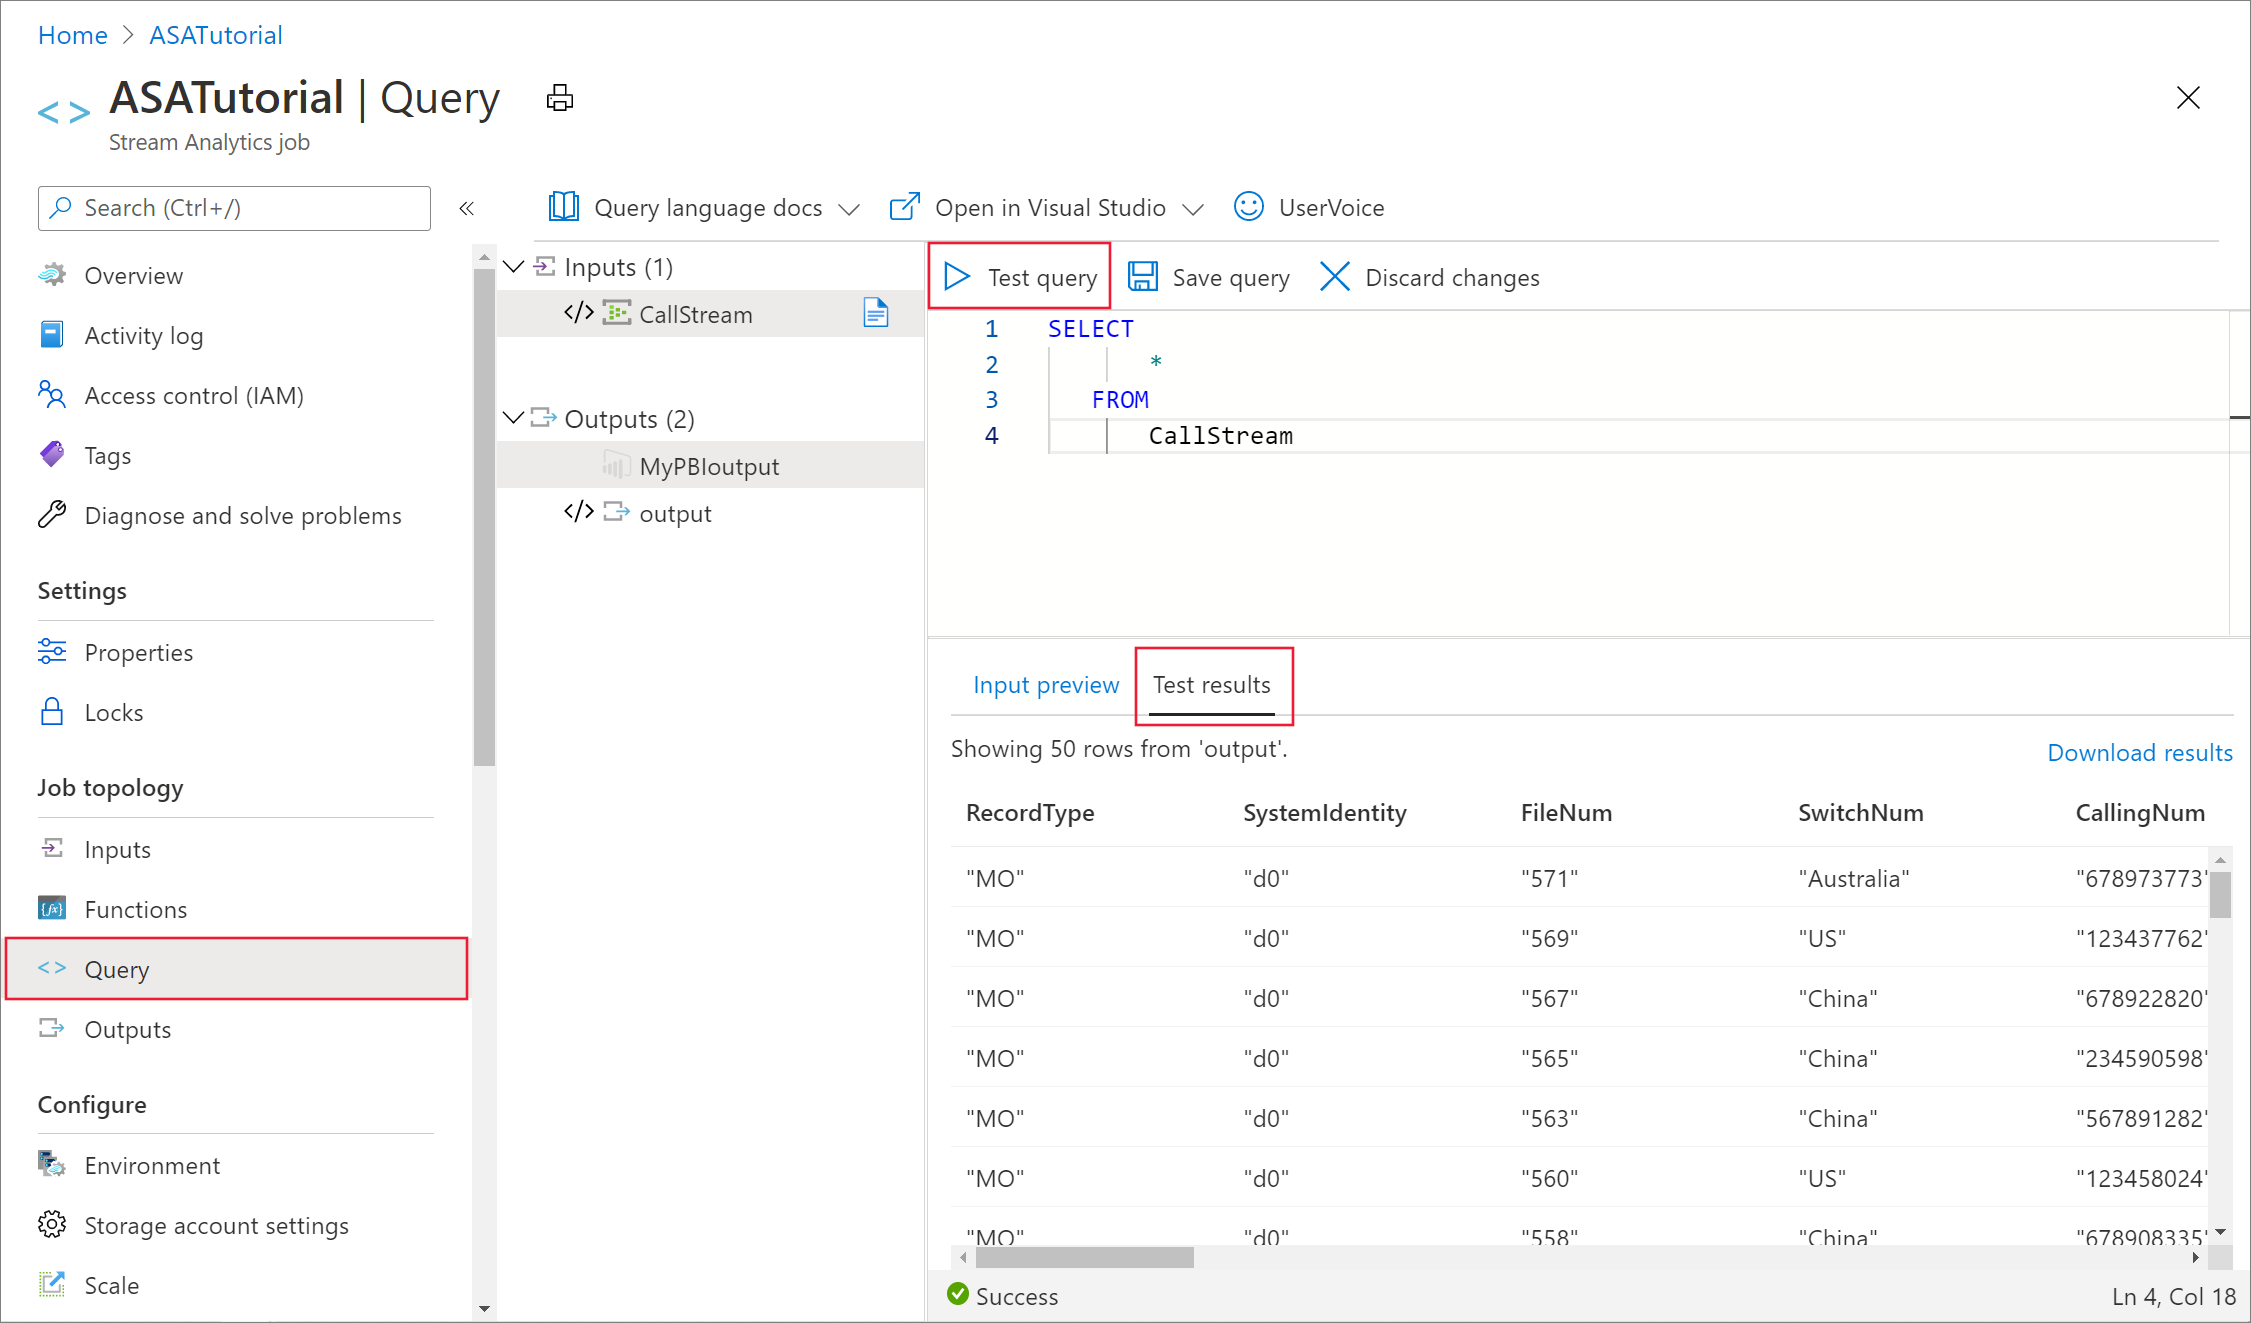
The exact number of records you see depends on how many records were captured in the sample.
Reduce the number of fields using a column projection
In many cases, your analysis doesn't need all the columns from the input stream. You can use a query to project a smaller set of returned fields than in the pass-through query.
Run the following query and notice the output.
SELECT CallRecTime, SwitchNum, CallingIMSI, CallingNum, CalledNum
INTO
    [MyPBIoutput]
FROM
    CallStream
Count incoming calls by region: Tumbling window with aggregation
Suppose you want to count the number of incoming calls per region. In streaming data, when you want to perform aggregate functions like counting, you need to segment the stream into temporal units, since the data stream itself is effectively endless. You do this using a Streaming Analytics window function. You can then work with the data inside that window as a unit.
For this transformation, you want a sequence of temporal windows that don't overlap—each window has a discrete set of data that you can group and aggregate. This type of window is referred to as a Tumbling window. Within the Tumbling window, you can get a count of the incoming calls grouped by SwitchNum, which represents the country/region where the call originated.
Paste the following query in the query editor:
SELECT
    System.Timestamp as WindowEnd, SwitchNum, COUNT(*) as CallCount
FROM
    CallStream TIMESTAMP BY CallRecTime
GROUP BY TUMBLINGWINDOW(s, 5), SwitchNum
This query uses the
Timestamp Bykeyword in theFROMclause to specify which timestamp field in the input stream to use to define the Tumbling window. In this case, the window divides the data into segments by theCallRecTimefield in each record. (If no field is specified, the windowing operation uses the time that each event arrives at the event hub. See "Arrival Time vs Application Time" in Stream Analytics Query Language Reference.The projection includes
System.Timestamp, which returns a timestamp for the end of each window.To specify that you want to use a Tumbling window, you use the TUMBLINGWINDOW function in the
GROUP BYclause. In the function, you specify a time unit (anywhere from a microsecond to a day) and a window size (how many units). In this example, the Tumbling window consists of 5-second intervals, so you'll get a count by country/region for every 5 seconds' worth of calls.Select Test query. In the results, notice that the timestamps under WindowEnd are in 5-second increments.
Detect SIM fraud using a self-join
For this example, consider fraudulent usage to be calls that originate from the same user but in different locations within 5 seconds of one another. For example, the same user can't legitimately make a call from the US and Australia at the same time.
To check for these cases, you can use a self-join of the streaming data to join the stream to itself based on the CallRecTime value. You can then look for call records where the CallingIMSI value (the originating number) is the same, but the SwitchNum value (country/region of origin) isn't the same.
When you use a join with streaming data, the join must provide some limits on how far the matching rows can be separated in time. As noted earlier, the streaming data is effectively endless. The time bounds for the relationship are specified inside the ON clause of the join, using the DATEDIFF function. In this case, the join is based on a 5-second interval of call data.
Paste the following query in the query editor:
SELECT System.Timestamp AS WindowEnd, COUNT(*) AS FraudulentCalls
    INTO "MyPBIoutput"
    FROM "CallStream" CS1 TIMESTAMP BY CallRecTime
    JOIN "CallStream" CS2 TIMESTAMP BY CallRecTime
    ON CS1.CallingIMSI = CS2.CallingIMSI
    AND DATEDIFF(ss, CS1, CS2) BETWEEN 1 AND 5
    WHERE CS1.SwitchNum != CS2.SwitchNum
    GROUP BY TumblingWindow(Duration(second, 1))
This query is like any SQL join except for the
DATEDIFFfunction in the join. This version ofDATEDIFFis specific to Streaming Analytics, and it must appear in theON...BETWEENclause. The parameters are a time unit (seconds in this example) and the aliases of the two sources for the join. This function is different from the standard SQLDATEDIFFfunction.The
WHEREclause includes the condition that flags the fraudulent call: the originating switches aren't the same.Select Test query. Review the output, and then select Save query.
Start the job and visualize output
To start the job, navigate to the job Overview and select Start.
Select Now for job output start time and select Start. You can view the job status in the notification bar.
Once the job succeeds, navigate to Power BI and sign in with your work or school account. If the Stream Analytics job query is outputting results, the ASAdataset dataset you created exists under the Datasets tab.
From your Power BI workspace, select + Create to create a new dashboard named Fraudulent Calls.
At the top of the window, select Edit and Add tile.
In the Add tile window, select Custom Streaming Data and Next.
Choose the ASAdataset under Your Datasets, and select Next.
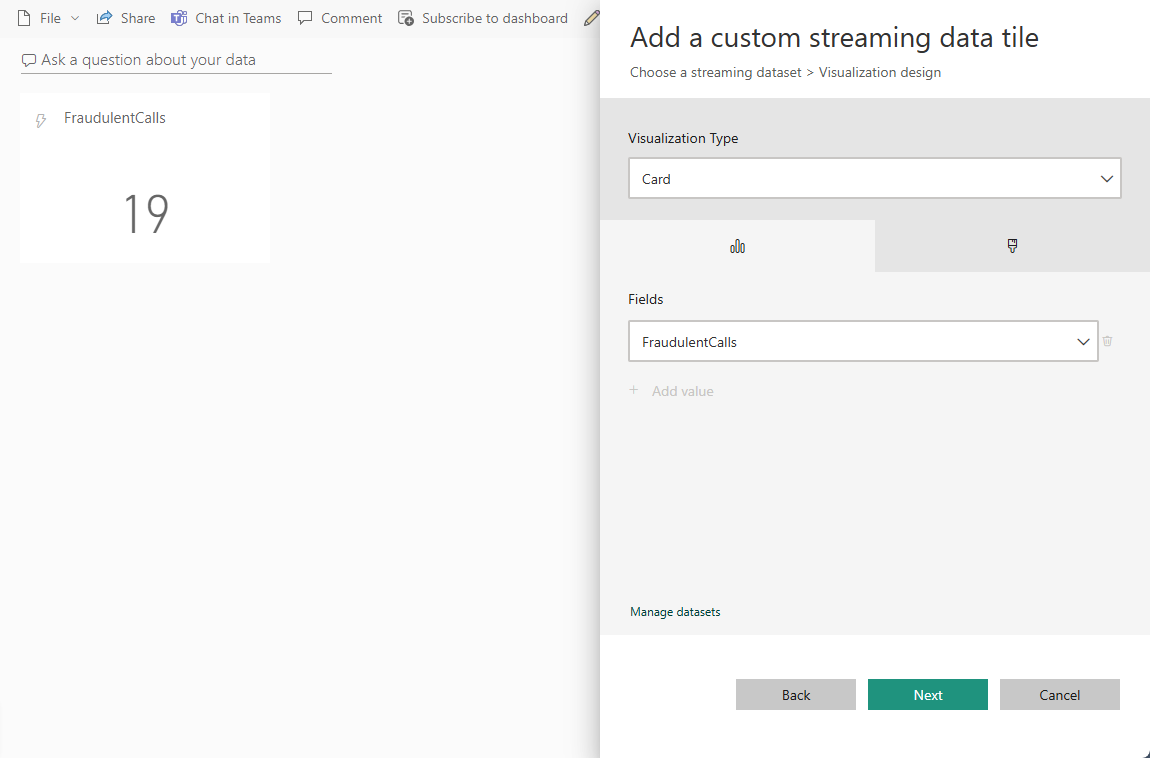
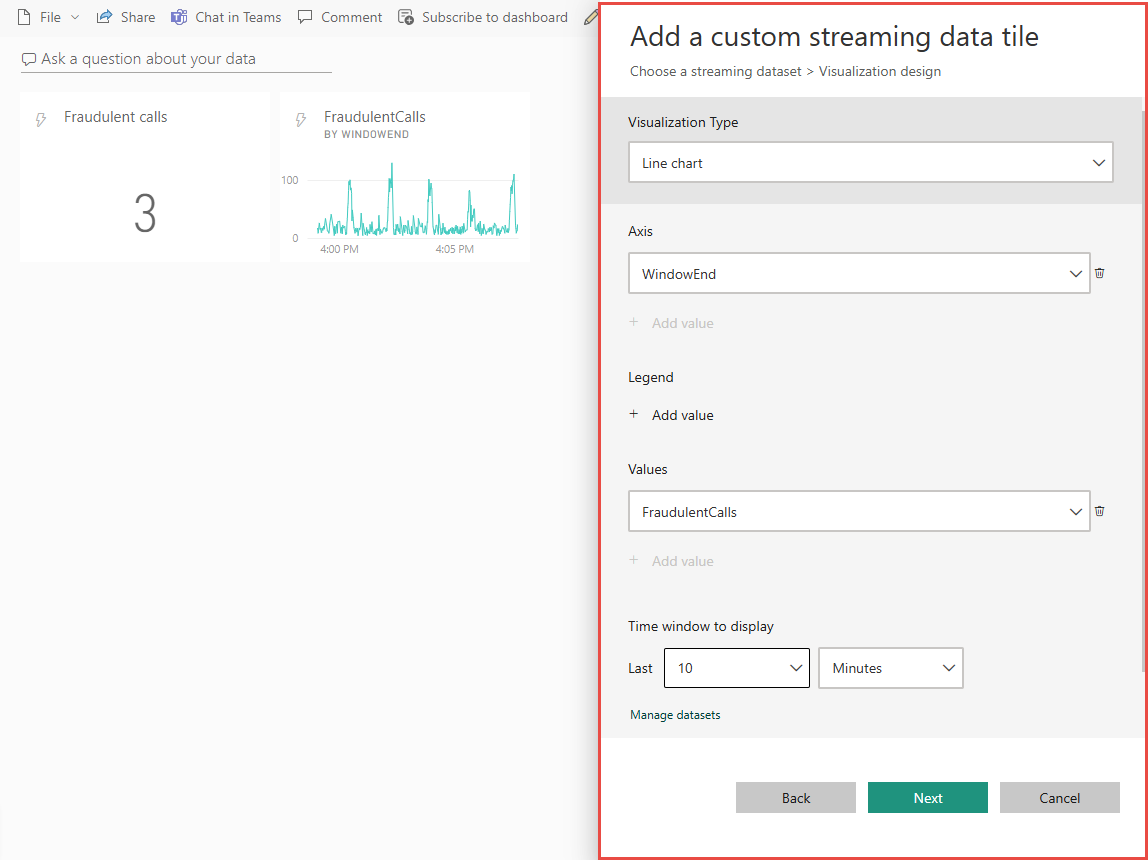
Select Card from the Visualization type dropdown, add fraudulent calls to Fields, and then select Next.
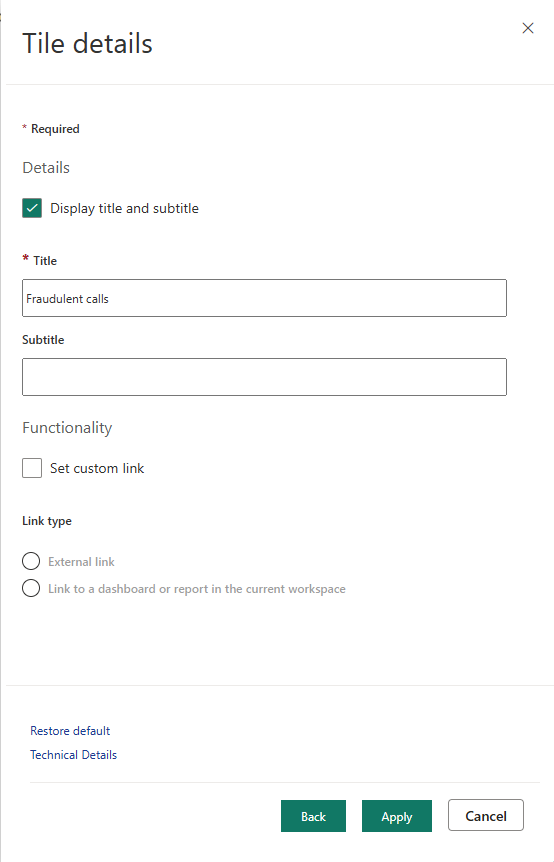
Enter a name for the tile (for example, Fraudulent calls), and then select Apply to create the tile.
Follow the step 5 again with the following options:
- When you get to Visualization Type, select Line chart.
- Add an axis and select windowend.
- Add a value and select fraudulent calls.
- For Time window to display, select the last 10 minutes.
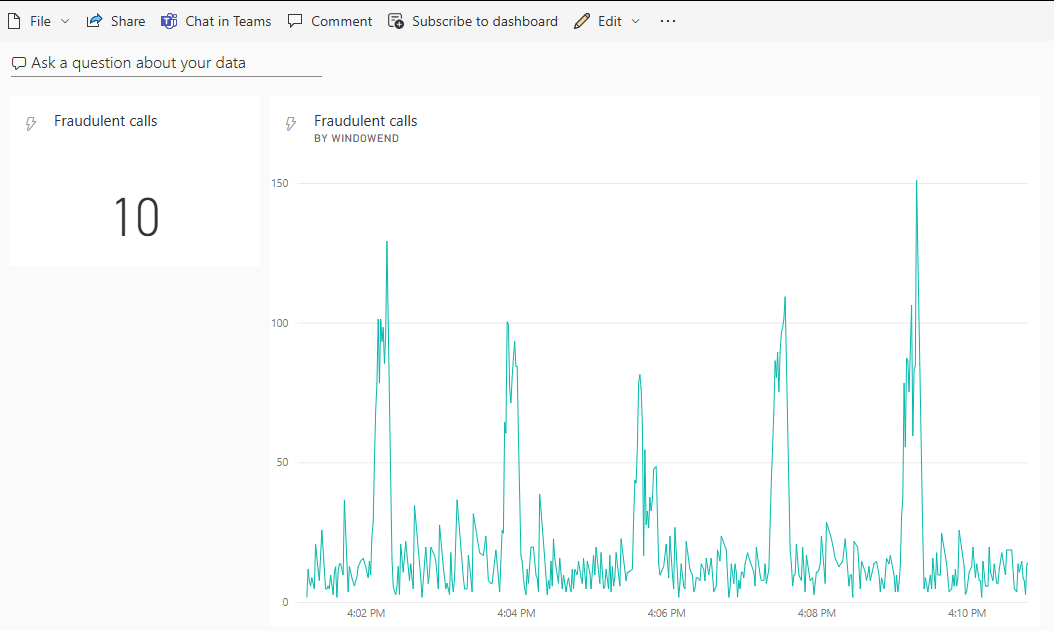
Your dashboard should look like the following example once both tiles are added. Notice that, if your event hub sender application and Streaming Analytics application are running, your Power BI dashboard periodically updates as new data arrives.
Embedding your Power BI Dashboard in a web application
For this part of the tutorial, you use a sample ASP.NET web application created by the Power BI team to embed your dashboard. For more information about embedding dashboards, see embedding with Power BI article.
To set up the application, go to the Power BI-Developer-Samples GitHub repository and follow the instructions under the User Owns Data section (use the redirect and homepage URLs under the integrate-web-app subsection). Since we're using the Dashboard example, use the integrate-web-app sample code located in the GitHub repository. Once you have the application running in your browser, follow these steps to embed the dashboard you created earlier into the web page:
Select Sign in to Power BI, which grants the application access to the dashboards in your Power BI account.
Select the Get Dashboards button, which displays your account's Dashboards in a table. Find the name of the dashboard you created earlier, powerbi-embedded-dashboard, and copy the corresponding EmbedUrl.
Finally, paste the EmbedUrl into the corresponding text field and select Embed Dashboard. You can now view the same dashboard embedded within a web application.
Next steps
In this tutorial, you created a simple Stream Analytics job, analyzed the incoming data, and presented results in a Power BI dashboard. To learn more about Stream Analytics jobs, continue to the next tutorial:
