Note
Access to this page requires authorization. You can try signing in or changing directories.
Access to this page requires authorization. You can try changing directories.
Monitoring the health and performance of an HDInsight cluster is essential for maintaining optimal performance and resource utilization. Monitoring can also help you detect and address cluster configuration errors and user code issues.
The following sections describe how to monitor and optimize the load on your clusters, Apache Hadoop YARN queues and detect storage throttling issues.
Monitor cluster load
Hadoop clusters can deliver the most optimal performance when the load on cluster is evenly distributed across all the nodes. This enables the processing tasks to run without being constrained by RAM, CPU, or disk resources on individual nodes.
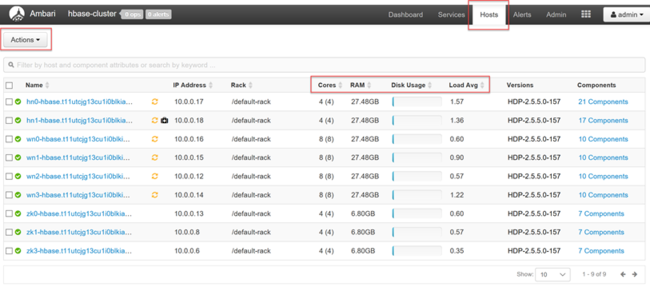
To get a high-level look at the nodes of your cluster and their loading, sign in to the Ambari Web UI, then select the Hosts tab. Your hosts are listed by their fully qualified domain names. Each host's operating status is shown by a colored health indicator:
| Color | Description |
|---|---|
| Red | At least one master component on the host is down. Hover to see a tooltip that lists affected components. |
| Orange | At least one secondary component on the host is down. Hover to see a tooltip that lists affected components. |
| Yellow | Ambari Server hasn't received a heartbeat from the host for more than 3 minutes. |
| Green | Normal running state. |
You'll also see columns showing the number of cores and amount of RAM for each host, and the disk usage and load average.
Select any of the host names for a detailed look at components running on that host and their metrics. The metrics are shown as a selectable timeline of CPU usage, load, disk usage, memory usage, network usage, and numbers of processes.
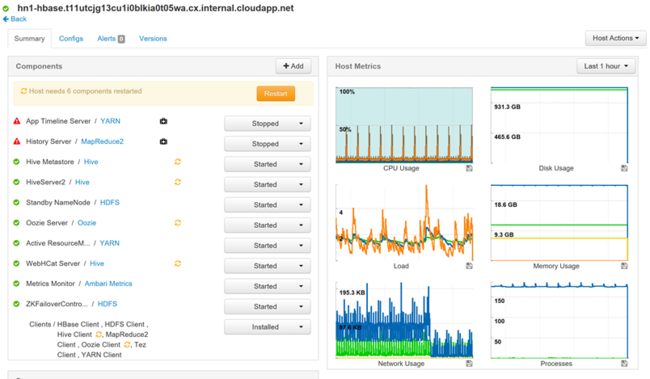
See Manage HDInsight clusters by using the Apache Ambari Web UI for details on setting alerts and viewing metrics.
YARN queue configuration
Hadoop has various services running across its distributed platform. YARN (Yet Another Resource Negotiator) coordinates these services and allocates cluster resources to ensure that any load is evenly distributed across the cluster.
YARN divides the two responsibilities of the JobTracker, resource management and job scheduling/monitoring, into two daemons: a global Resource Manager, and a per-application ApplicationMaster (AM).
The Resource Manager is a pure scheduler, and solely arbitrates available resources between all competing applications. The Resource Manager ensures that all resources are always in use, optimizing for various constants such as SLAs, capacity guarantees, and so forth. The ApplicationMaster negotiates resources from the Resource Manager, and works with the NodeManager(s) to execute and monitor the containers and their resource consumption.
When multiple tenants share a large cluster, there's competition for the cluster's resources. The CapacityScheduler is a pluggable scheduler that assists in resource sharing by queueing up requests. The CapacityScheduler also supports hierarchical queues to ensure that resources are shared between the subqueues of an organization, before other applications' queues are allowed to use free resources.
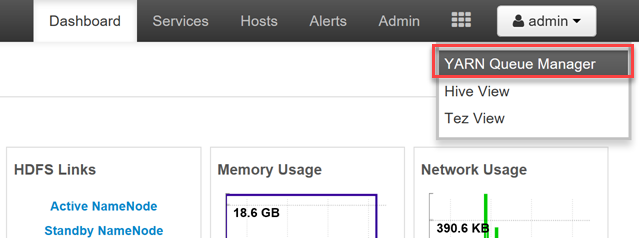
YARN allows us to allocate resources to these queues, and shows you whether all of your available resources are assigned. To view information about your queues, sign in to the Ambari Web UI, then select YARN Queue Manager from the top menu.
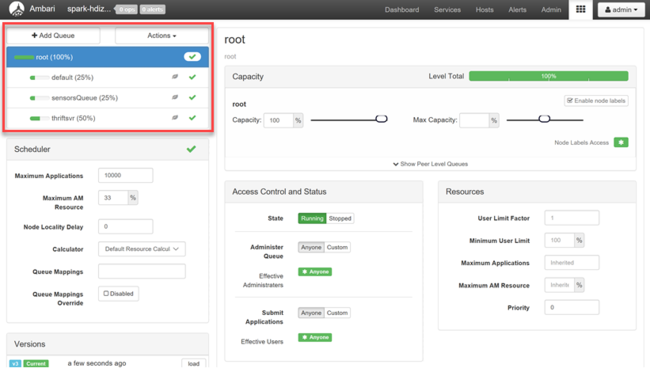
The YARN Queue Manager page shows a list of your queues on the left, along with the percentage of capacity assigned to each.
For a more detailed look at your queues, from the Ambari dashboard, select the YARN service from the list on the left. Then under the Quick Links dropdown menu, select Resource Manager UI underneath your active node.

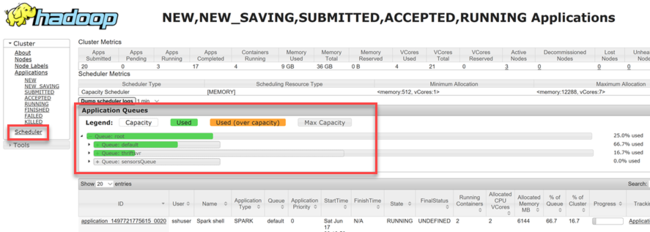
In the Resource Manager UI, select Scheduler from the left-hand menu. You see a list of your queues underneath Application Queues. Here you can see the capacity used for each of your queues, how well the jobs are distributed between them, and whether any jobs are resource-constrained.
Storage throttling
A cluster's performance bottleneck can happen at the storage level. This type of bottleneck is most often because of blocking input/output (IO) operations, which happen when your running tasks send more IO than the storage service can handle. This blocking creates a queue of IO requests waiting to be processed until after current IOs are processed. The blocks are because of storage throttling, which isn't a physical limit, but rather a limit imposed by the storage service by a service level agreement (SLA). This limit ensures that no single client or tenant can monopolize the service. The SLA limits the number of IOs per second (IOPS) for Azure Storage - for details, see Scalability and performance targets for standard storage accounts.
If you're using Azure Storage, for information on monitoring storage-related issues, including throttling, see Monitor, diagnose, and troubleshoot Azure Storage.
Troubleshoot sluggish node performance
In some cases, sluggishness can occur because of low disk space on the cluster. Investigate with these steps:
Use ssh command to connect into each of the nodes.
Check the disk usage by running one of the following commands:
df -h
du -h --max-depth=1 / | sort -h
Review the output, and check for the presence of any large files in the
mntfolder or other folders. Typically, theusercache, andappcache(mnt/resource/hadoop/yarn/local/usercache/hive/appcache/) folders contain large files.If there are large files, either a current job is causing the file growth or a failed previous job may have contributed to this issue. To check whether this behavior is caused by a current job, run the following command:
sudo du -h --max-depth=1 /mnt/resource/hadoop/yarn/local/usercache/hive/appcache/If this command indicates a specific job, you can choose to terminate the job by using a command that resembles the following:
yarn application -kill -applicationId <application_id>Replace
application_idwith the application ID. If no specific jobs are indicated, go to the next step.After the command above completes, or if no specific jobs are indicated, delete the large files you identified by running a command that resembles the following:
rm -rf filecache usercache
For more information regarding disk space issues, see Out of disk space.
Note
If you have large files that you want to keep but are contributing to the low disk space issue, you have to scale up your HDInsight cluster and restart your services. After you complete this procedure and wait for a few minutes, you will notice that the storage is freed up and the node's usual performance is restored.
Next steps
Visit the following links for more information about troubleshooting and monitoring your clusters: