Note
Access to this page requires authorization. You can try signing in or changing directories.
Access to this page requires authorization. You can try changing directories.
You can pull aggregate metrics on your MLflow runs using the mlflow.search_runs API and display them in a dashboard. Regularly such reviewing metrics can provide insight into your progress and productivity. For example, you can track improvement of a goal metric like revenue or accuracy over time, across many runs and/or experiments.
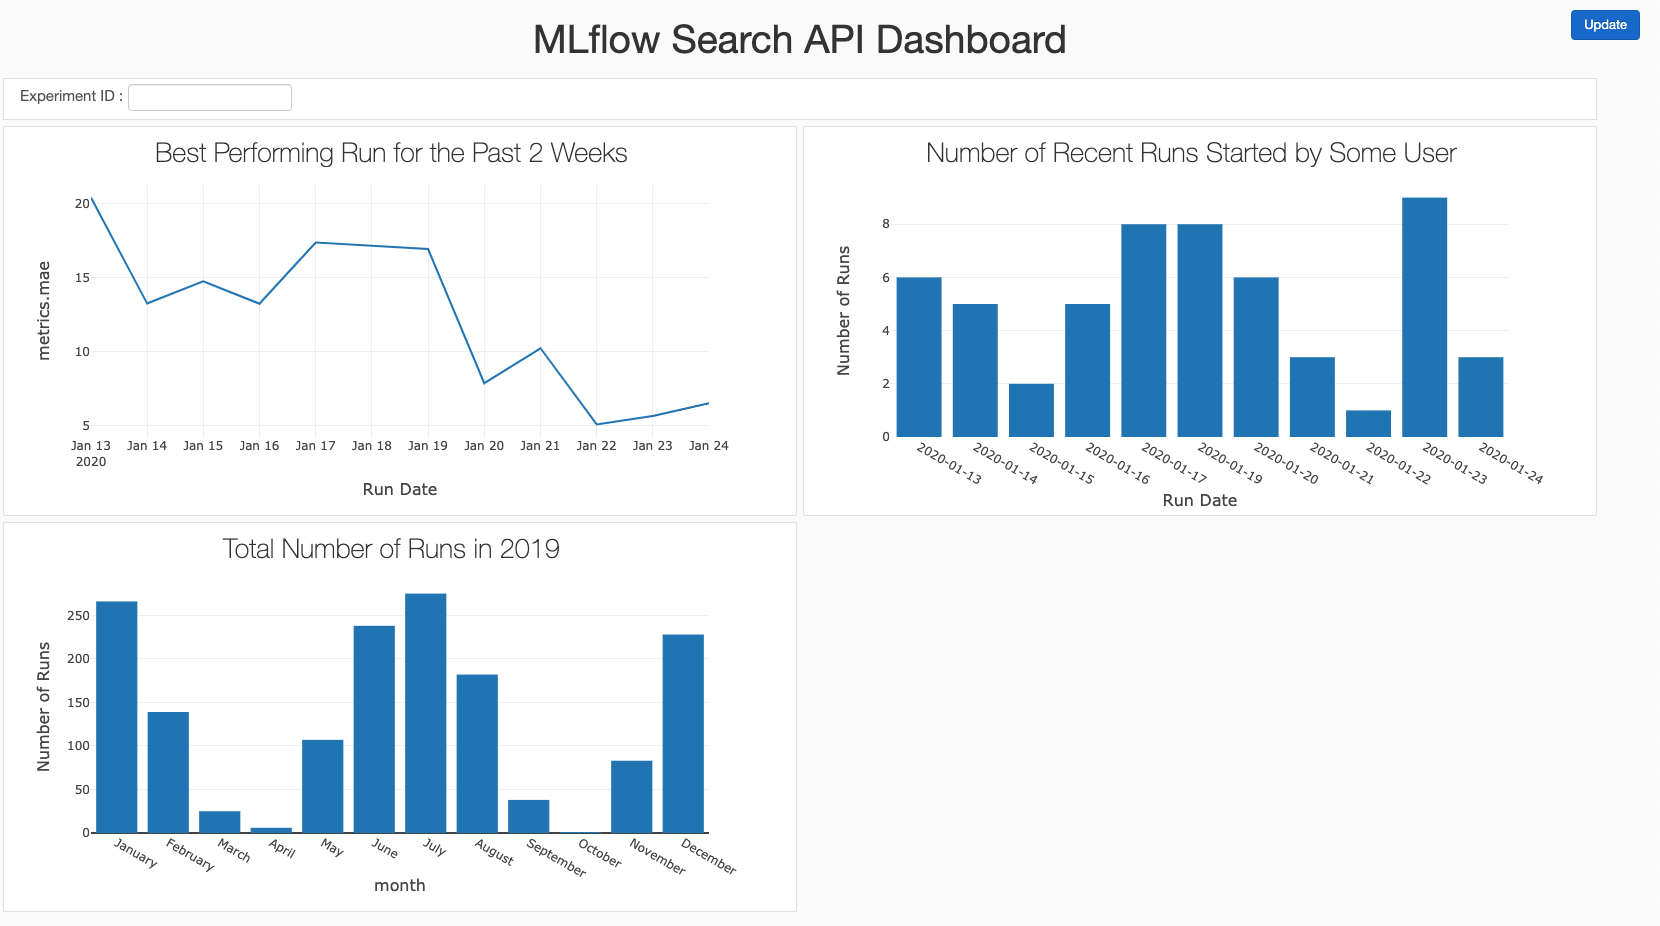
This notebook demonstrates how to build the following custom dashboard using the mlflow.search_runs API:
You can either run the notebook on your own experiments or against autogenerated mock experiment data.