Note
Access to this page requires authorization. You can try signing in or changing directories.
Access to this page requires authorization. You can try changing directories.
APPLIES TO:  Azure Data Factory
  Azure Synapse Analytics
You can use an Azure Data Factory managed virtual network to securely connect your data sources to a virtual network that the Data Factory service manages. By using this capability, you can establish a private and isolated environment for your data integration and orchestration processes.
When you use a managed virtual network, you combine the data integration and orchestration capabilities in Data Factory with the security and flexibility of Azure virtual networks. It empowers you to build robust, scalable, and secure data integration pipelines that seamlessly connect to your network resources, whether they're on-premises or in the cloud.
One common problem of managed compute is the lack of visibility into performance and health, especially within a managed virtual network environment. Without proper monitoring, identifying and resolving problems becomes challenging and can lead to potential delays, errors, and performance degradation.
By using enhanced monitoring in Data Factory, you can gain valuable insights into your data integration processes. These insights can lead to improved efficiency, better resource utilization, and enhanced overall performance. With proactive monitoring and timely alerts, you can address issues, optimize workflows, and ensure the smooth execution of your data integration pipelines within the managed virtual network environment.
New metrics
The introduction of new metrics enhances the visibility and monitoring capabilities within managed virtual network environments.
Azure Data Factory provides three distinct types of compute pools:
- Compute for a copy activity
- Compute for a pipeline activity, such as a lookup
- Compute for an external activity, such as an Azure Databricks notebook
These compute pools offer flexibility and scalability to accommodate diverse workloads and allocate resources optimally. Each is tailored to handle specific activity execution requirements.
To help ensure consistent and comprehensive monitoring across all compute pools, we've implemented the same sets of monitoring metrics:
- Capacity utilization
- Available capacity percentage
- Waiting queue length
Regardless of the type of compute pool that you're using, you can access and analyze a standardized set of metrics to gain insights into the performance and health of your data integration activities.
Note
These metrics are valid only when you're enabling time-to-live (TTL) in an integration runtime within a managed virtual network.
| Metric | Unit | Description |
|---|---|---|
| Copy capacity utilization of MVNet integration runtime | Percent | The maximum percentage of Data Integration Unit (DIU) utilization for TTL copy activities in a managed virtual network's integration runtime within a 1-minute window. |
| Copy available capacity percentage of MVNet integration runtime | Percent | The maximum percentage of available DIU for TTL copy activities in a managed virtual network's integration runtime within a 1-minute window. |
| Copy waiting queue length of MVNet integration runtime | Count | The waiting queue length of TTL copy activities in a managed virtual network's integration runtime within a 1-minute window. |
| Pipeline capacity utilization of MVNet integration runtime | Percent | The maximum percentage of DIU utilization for pipeline activities in a managed virtual network's integration runtime within a 1-minute window. |
| Pipeline available capacity percentage of MVNet integration runtime | Percent | The maximum percentage of available DIU for pipeline activities in a managed virtual network's integration runtime within a 1-minute window. |
| Pipeline waiting queue length of MVNet integration runtime | Count | The waiting queue length of pipeline activities in a managed virtual network's integration runtime within a 1-minute window. |
| External capacity utilization of MVNet integration runtime | Percent | The maximum percentage of DIU utilization for external activities in a managed virtual network's integration runtime within a 1-minute window. |
| External available capacity percentage of MVNet integration runtime | Percent | The maximum percentage of available DIU for external activities in a managed virtual network's integration runtime within a 1-minute window. |
| External waiting queue length of MVNet integration runtime | Count | The waiting queue length of external activities in a managed virtual network's integration runtime within a 1-minute window. |
For more information about these metrics, see Supported metrics for Microsoft.DataFactory/factories.
Using metrics for performance optimization
By using the metrics, you can seamlessly track and assess the performance and robustness of your integration runtime within a managed virtual network. You can also uncover potential areas for continuous improvement by optimizing the compute settings and workflow to maximize efficiency.
To provide more clarity on the practical application of these metrics, here are a few example scenarios.
Balanced
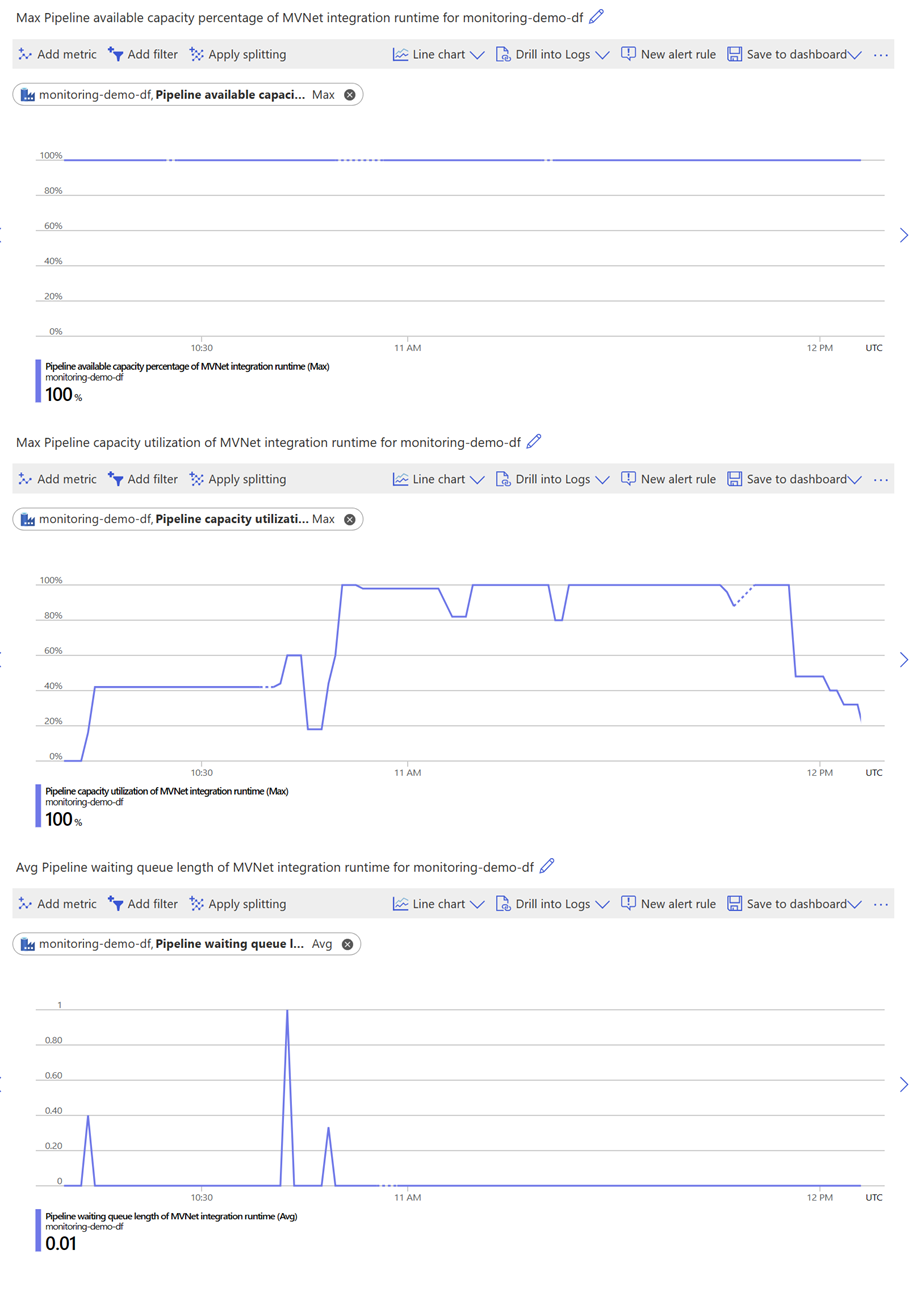
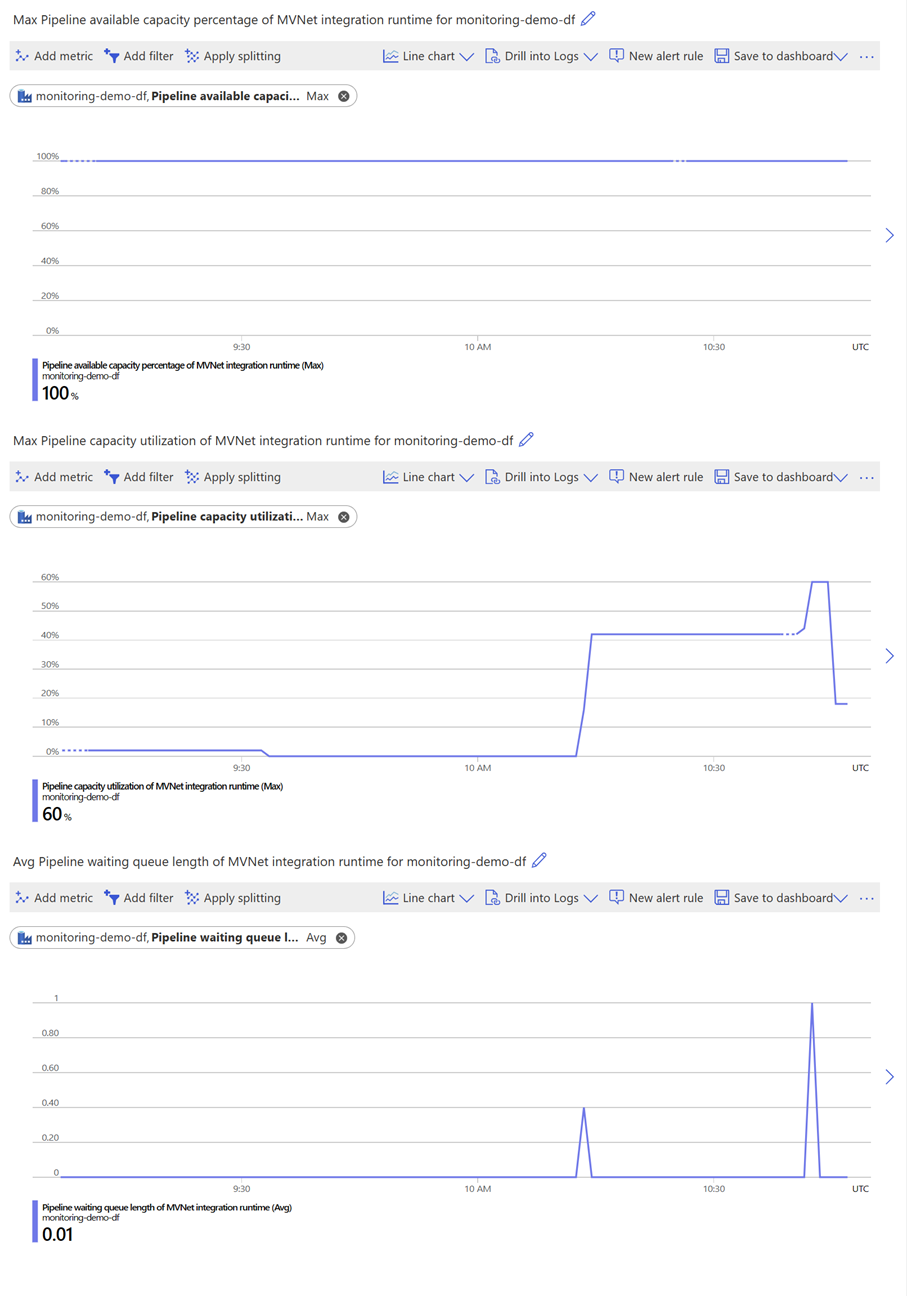
If you observe that capacity utilization is below 100 percent and the available capacity percentage is high, the compute resources that you reserved are being efficiently utilized.
If the waiting queue length remains consistently low or experiences occasional short spikes, we advise you to queue other activities until the capacity utilization reaches 100 percent. This approach helps ensure optimal utilization of resources and helps maintain a smooth workflow with minimal delays.
Performance oriented
If you observe that capacity utilization is consistently low, and the waiting queue length remains consistently low or experiences occasional short spikes, the compute resources that you reserved are higher than the demand for activities.
In such cases, regardless of whether the available capacity percentage is high or low, we recommend that you reduce the allocated compute resources to lower your costs. By rightsizing the compute to match the workload requirements, you can optimize your resource utilization and save costs without compromising the efficiency of your operations.
Cost oriented
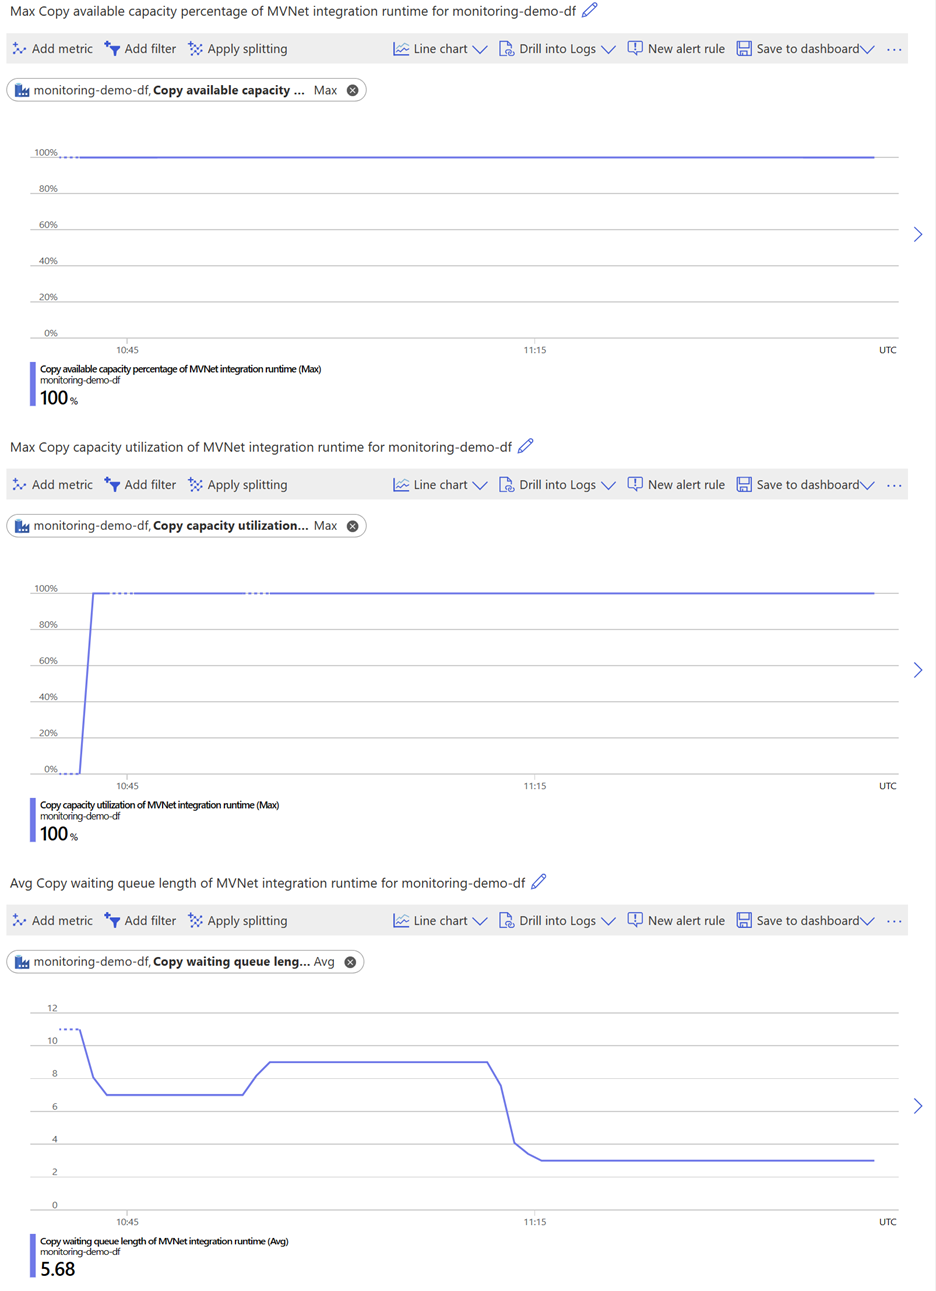
If you notice that all metrics (including capacity utilization, available capacity percentage, and waiting queue length) are high, the compute resources that you reserved are likely insufficient for your activities.
In this scenario, we recommend that you increase the allocated compute resources to reduce queue time. Adding more compute capacity helps ensure that your activities have sufficient resources to run efficiently, which minimizes any delays that a crowded queue causes.
Intermittent activity execution
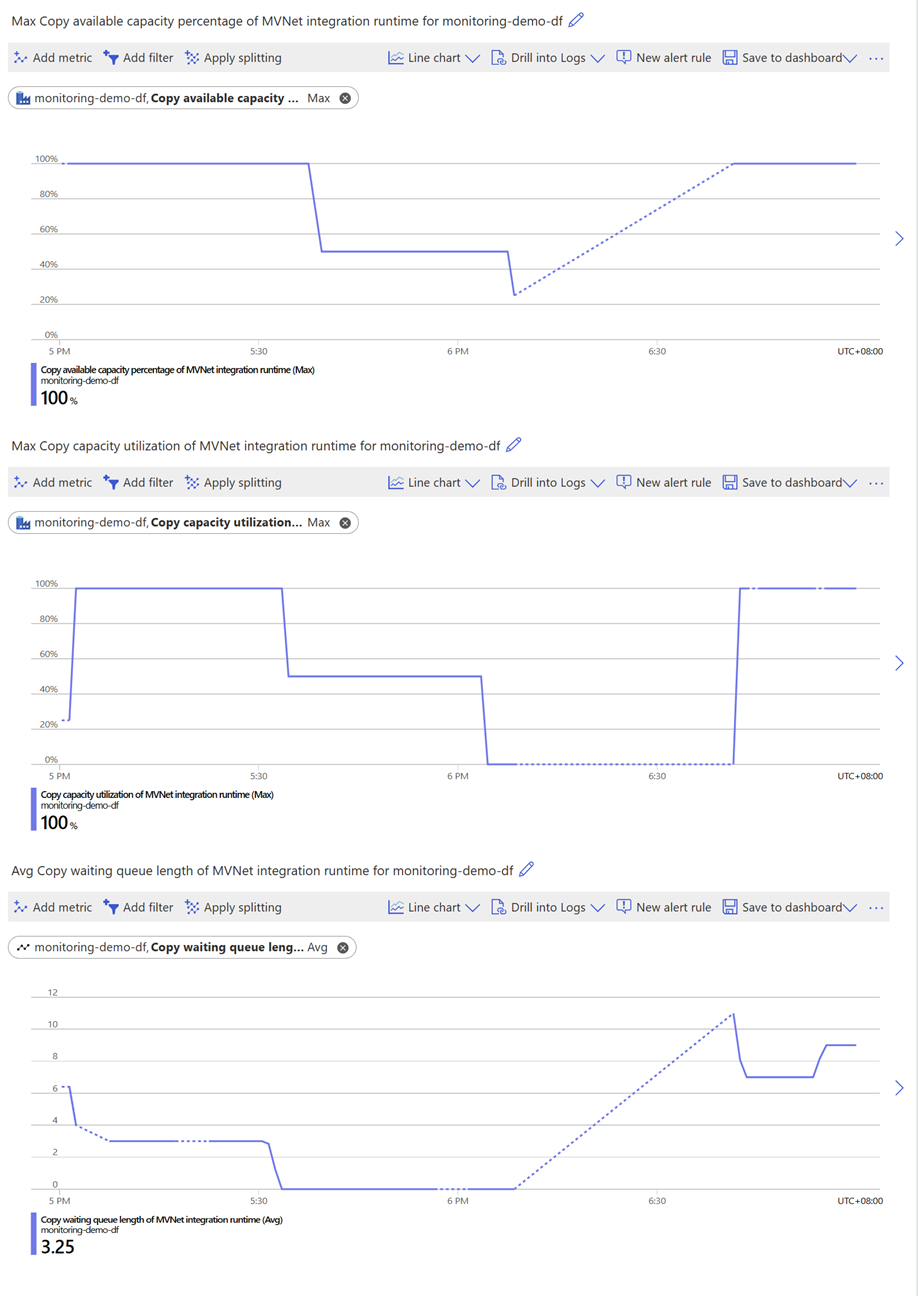
If you notice that the Available Capacity Percentage fluctuates between low and high within a specific time period, it's likely due to the intermittent execution of your activities, where the Time-To-Live (TTL) period you have configured is shorter than the interval between your activities. This can have a significant impact on the performance of your workflow. To address this issue, there are two possible solutions. First, you can queue more activities to maintain a consistent workload and utilize the available compute resources more effectively. By keeping the compute continuously engaged, you can avoid the warm-up time and achieve better performance. Alternatively, you can consider enlarging the TTL period to align with the interval between your activities. This ensures that the compute resources remain available for a longer duration, reducing the frequency of warm-up periods and optimizing cost-efficiency.
By implementing either of these solutions, you can enhance the performance of your workflow, minimize cost implications, and ensure a smoother execution of your intermittent activities.
Related content
Advance to the following article to learn about managed virtual networks and managed private endpoints: Azure Data Factory managed virtual network.


