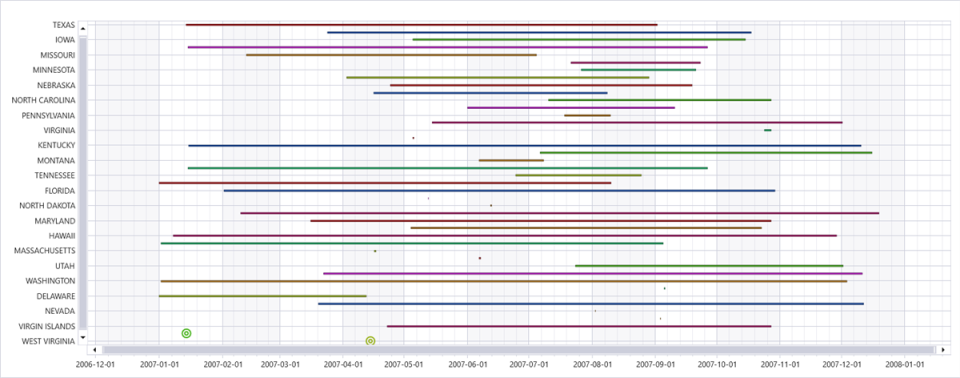
Ladder chart
Applies to: ✅ Azure Data Explorer
The last two columns are the x-axis, and the other columns are the y-axis.
Note
- This visualization can only be used in the context of the render operator.
- This visualization is available in Kusto.Explorer but not in the Azure Data Explorer web UI.
Syntax
T | render ladderchart [with (propertyName = propertyValue [, ...])]
Learn more about syntax conventions.
Parameters
| Name | Type | Required | Description |
|---|---|---|---|
| T | string |
✔️ | Input table name |
| propertyName, propertyValue | string |
A comma-separated list of key-value property pairs. See supported properties. |
Supported properties
All properties are optional.
| PropertyName | PropertyValue |
|---|---|
accumulate |
Whether the value of each measure gets added to all its predecessors. (true or false) |
legend |
Whether to display a legend or not (visible or hidden). |
series |
Comma-delimited list of columns whose combined per-record values define the series that record belongs to. |
ymin |
The minimum value to be displayed on Y-axis. |
ymax |
The maximum value to be displayed on Y-axis. |
title |
The title of the visualization (of type string). |
xaxis |
How to scale the x-axis (linear or log). |
xcolumn |
Which column in the result is used for the x-axis. |
xtitle |
The title of the x-axis (of type string). |
yaxis |
How to scale the y-axis (linear or log). |
ycolumns |
Comma-delimited list of columns that consist of the values provided per value of the x column. |
ytitle |
The title of the y-axis (of type string). |
Examples
The example in this section shows how to use the syntax to help you get started.
The examples in this article use publicly available tables in the help cluster, such as the StormEvents table in the Samples database.
Dates of storms by state
This query outputs a state-wise visualization of the duration of rain-related storm events, displayed as a ladder chart to help you analyze the temporal distribution of these events.
StormEvents
| where EventType  has "rain"
| summarize min(StartTime), max(EndTime) by State
| render ladderchart
Dates of storms by event type
This query outputs a visualization of the duration of various storm events in Washington, displayed as a ladder chart to help you analyze the temporal distribution of these events by type.
StormEvents
| where State == "WASHINGTON"
| summarize min(StartTime), max(EndTime) by EventType
| render ladderchart
Dates of storms by state and event type
This query outputs a visualization of the duration of various storm events in states starting with "W", displayed as a ladder chart to help you analyze the temporal distribution of these events by state and event type.
StormEvents
| where State startswith "W"
| summarize min(StartTime), max(EndTime) by State, EventType
| render ladderchart with (series=State, EventType)


