Note
Access to this page requires authorization. You can try signing in or changing directories.
Access to this page requires authorization. You can try changing directories.
Azure Backup provides a set of built-in metrics via Azure Monitor that enable you to monitor the health of your backups. It also allows you to configure alert rules that trigger when the metrics exceed defined thresholds.
Azure Backup offers the following key capabilities:
- Ability to view out-of-the-box metrics related to back up and restore health of your backup items along with associated trends
- Ability to write custom alert rules on these metrics to efficiently monitor the health of your backup items
- Ability to route fired metric alerts to different notification channels supported by Azure Monitor, such as email, ITSM, webhook, logic apps, and so on.
Learn more about Azure Monitor metrics.
Supported scenarios
Supports built-in metrics for the following workload types:
- Azure VM, SQL databases in Azure VM
- SAP HANA databases in Azure VM
- Azure Files
- Azure Blobs.
Metrics for HANA instance workload type are currently not supported.
Metrics can be viewed for all Recovery Services vaults in each region and subscription at a time. Viewing metrics for a larger scope in the Azure portal is currently not supported. The same limits are also applicable to configure metric alert rules.
Supported metrics
Currently, Azure Backup supports the following metrics:
Backup Health Events: The value of this metric represents the count of health events pertaining to backup job health, which were fired for the vault within a specific time. When a backup job completes, the Azure Backup service creates a backup health event. Based on the job status (such as succeeded or failed), the dimensions associated with the event vary.
Restore Health Events: The value of this metric represents the count of health events pertaining to restore job health, which were fired for the vault within a specific time. When a restore job completes, the Azure Backup service creates a restore health event. Based on the job status (such as succeeded or failed), the dimensions associated with the event vary.
Note
We support Restore Health Events only for Azure Blobs workload, as backups are continuous, and there's no notion of backup jobs here.
By default, the counts are surfaced at the vault level. To view the counts for a particular backup item and job status, you can filter the metrics on any of the supported dimensions.
The following table lists the dimensions that Backup Health Events and Restore Health Events metrics supports:
| Dimension Name | Description |
|---|---|
| Datasource ID | The unique ID of the datasource associated with the job.
For SQL AG database backup, the Datasource ID field is empty as there is no datasource (VM) in such scenarios. To view metrics for a particular database within an AG, use the Backup Instance ID field. |
| Datasource Type | The type of the datasource associated with the job. Following are the supported datasource types:
|
| Backup Instance ID | The ARM ID of the backup instance associated with the job. For example, /subscriptions/00000000-0000-0000-0000-000000000000/resourceGroups/testRG/providers/Microsoft.RecoveryServices/vaults/testVault/backupFabrics/Azure/protectionContainers/IaasVMContainer;iaasvmcontainerv2;testRG;testVM/protectedItems/VM;iaasvmcontainerv2;testRG;testVM |
| Backup Instance Name | Friendly name of the backup instance for easy readability. It's of the format {protectedContainerName};{backupItemFriendlyName}. For example, testStorageAccount;testFileShare |
| Health Status | Represents the health of the backup item after the job had completed. It can take one of the following values: Healthy, Transient Unhealthy, Persistent Unhealthy, Transient Degraded, Persistent Degraded.
|
View metrics in the Azure portal
To view metrics in the Azure portal, follow the below steps:
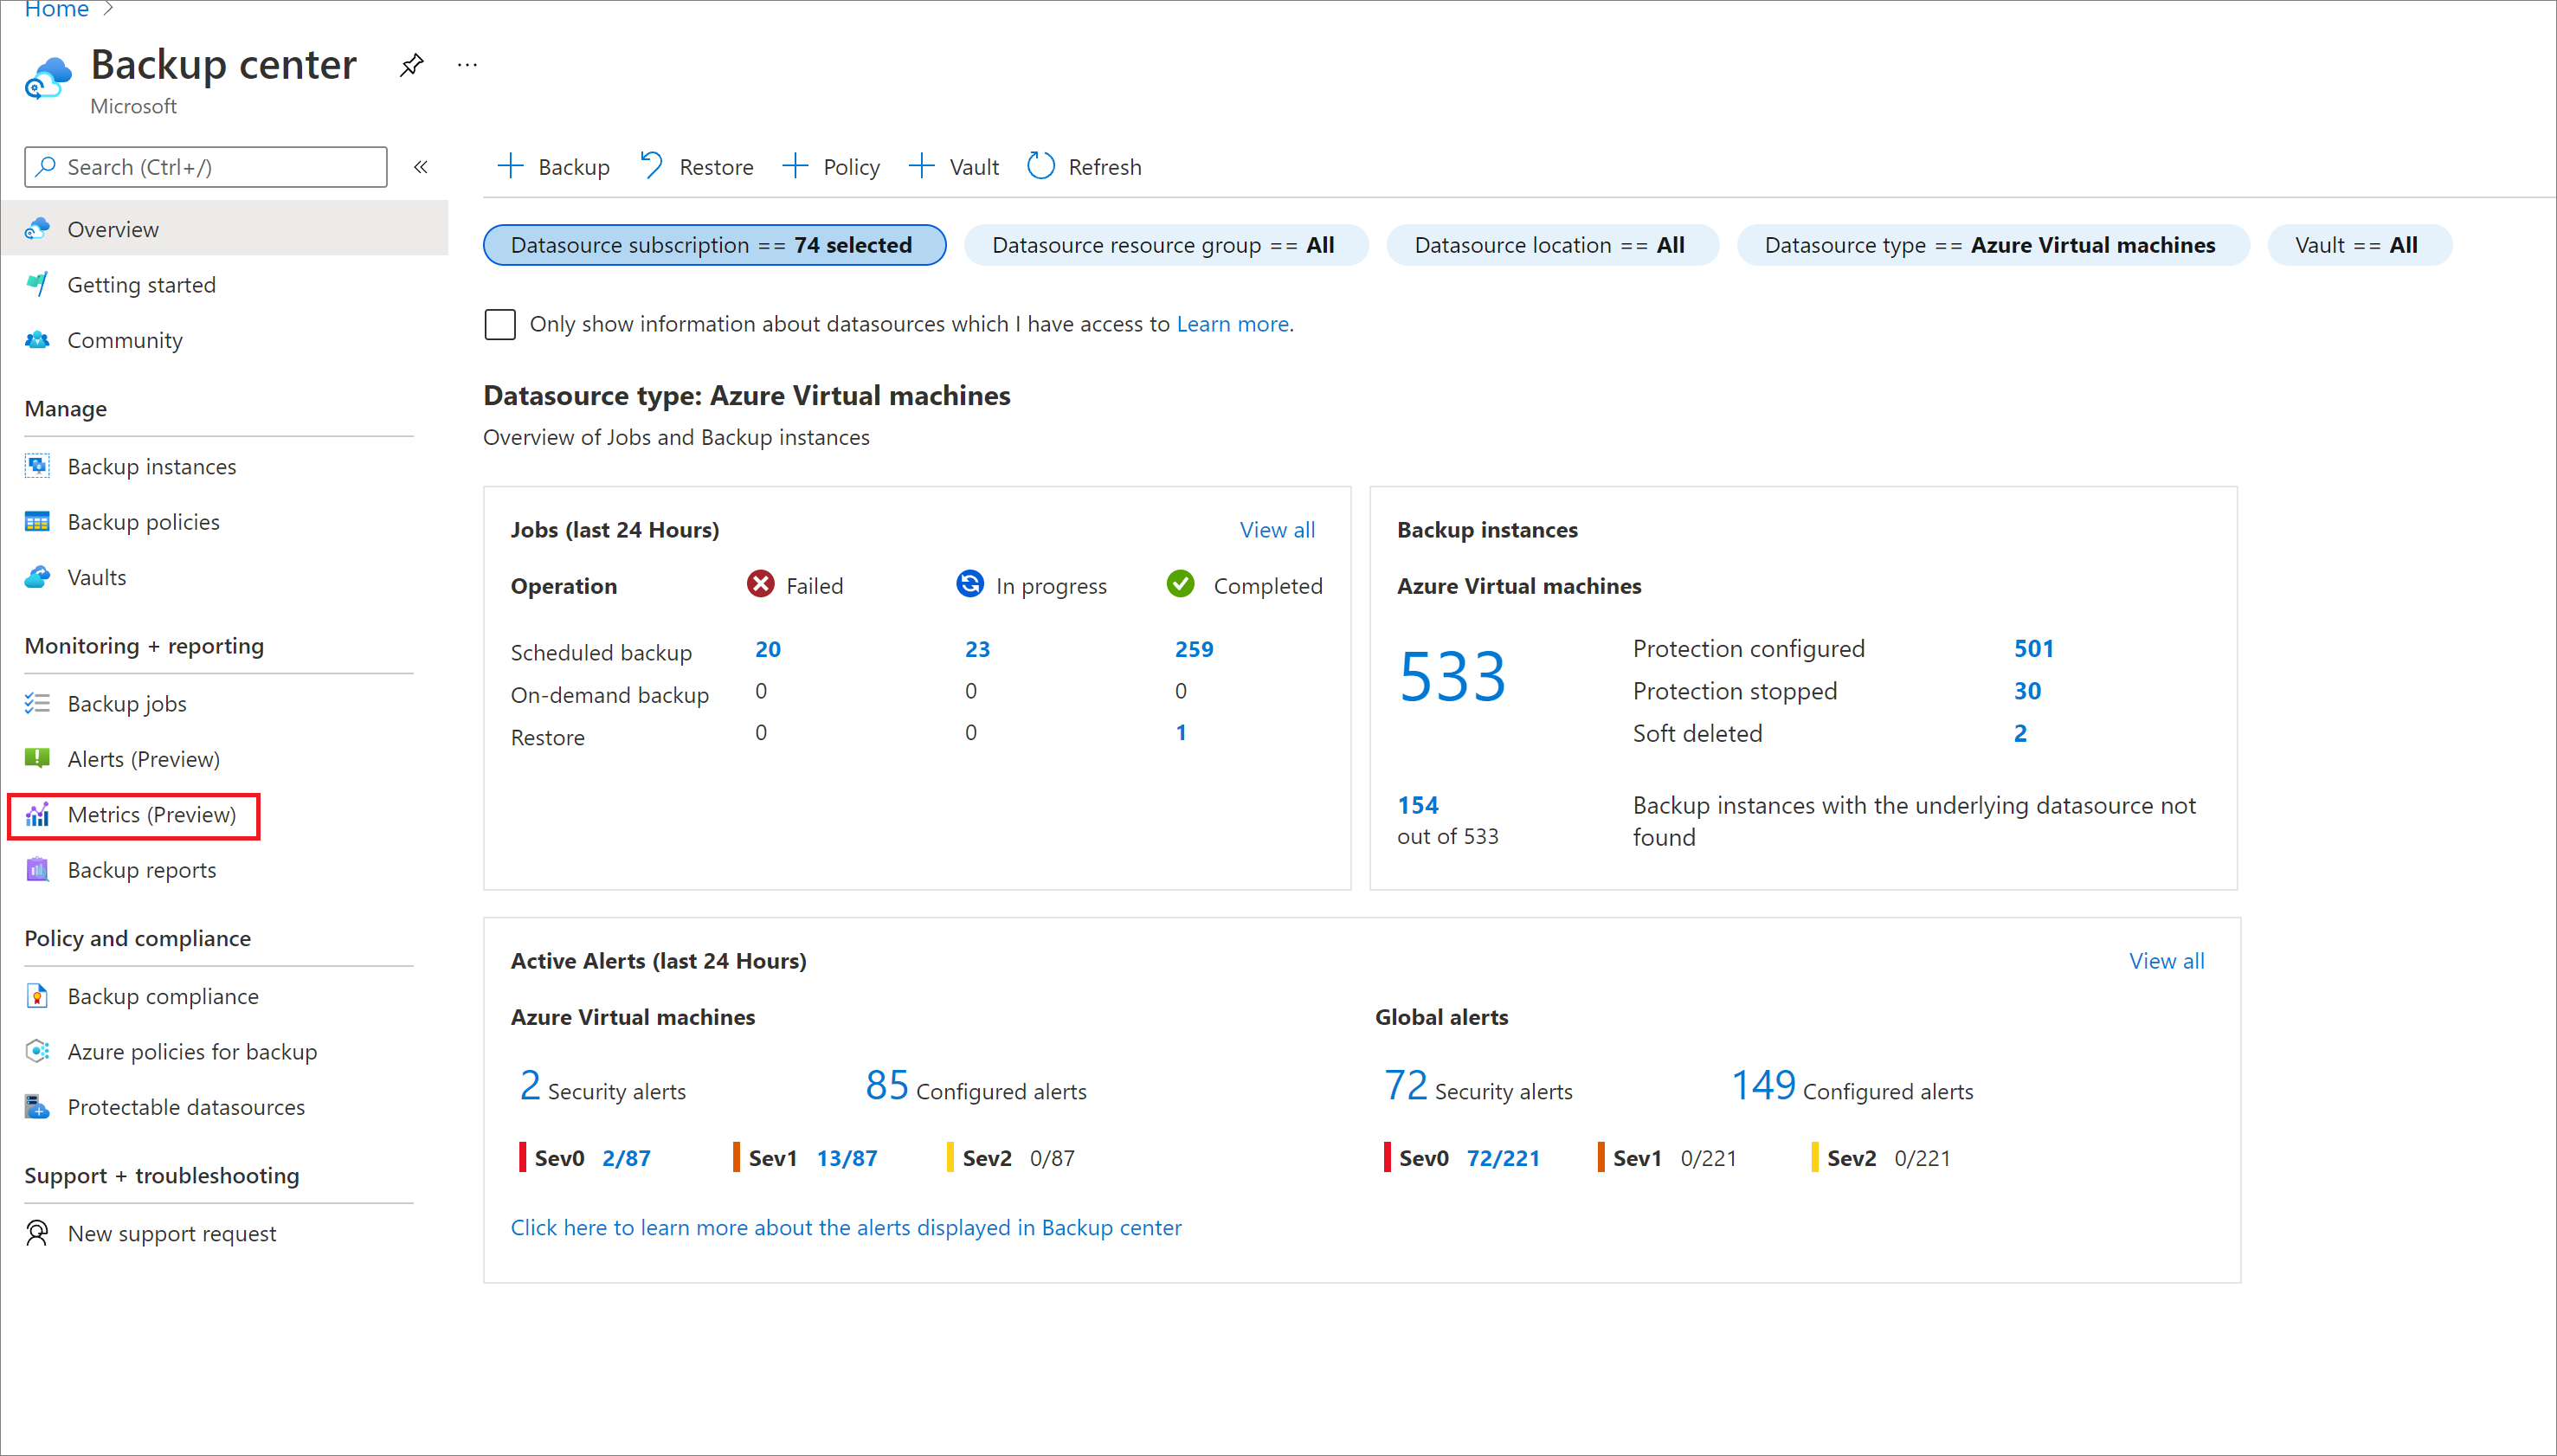
Go to Backup center in the Azure portal and click Metrics from the menu.
Select a vault or a group of vaults for which you want to view metrics.
Currently, the maximum scope for which you can view metrics is: All Recovery Services vaults in a particular subscription and region. For example, All Recovery Services vaults in China North in TestSubscription1.
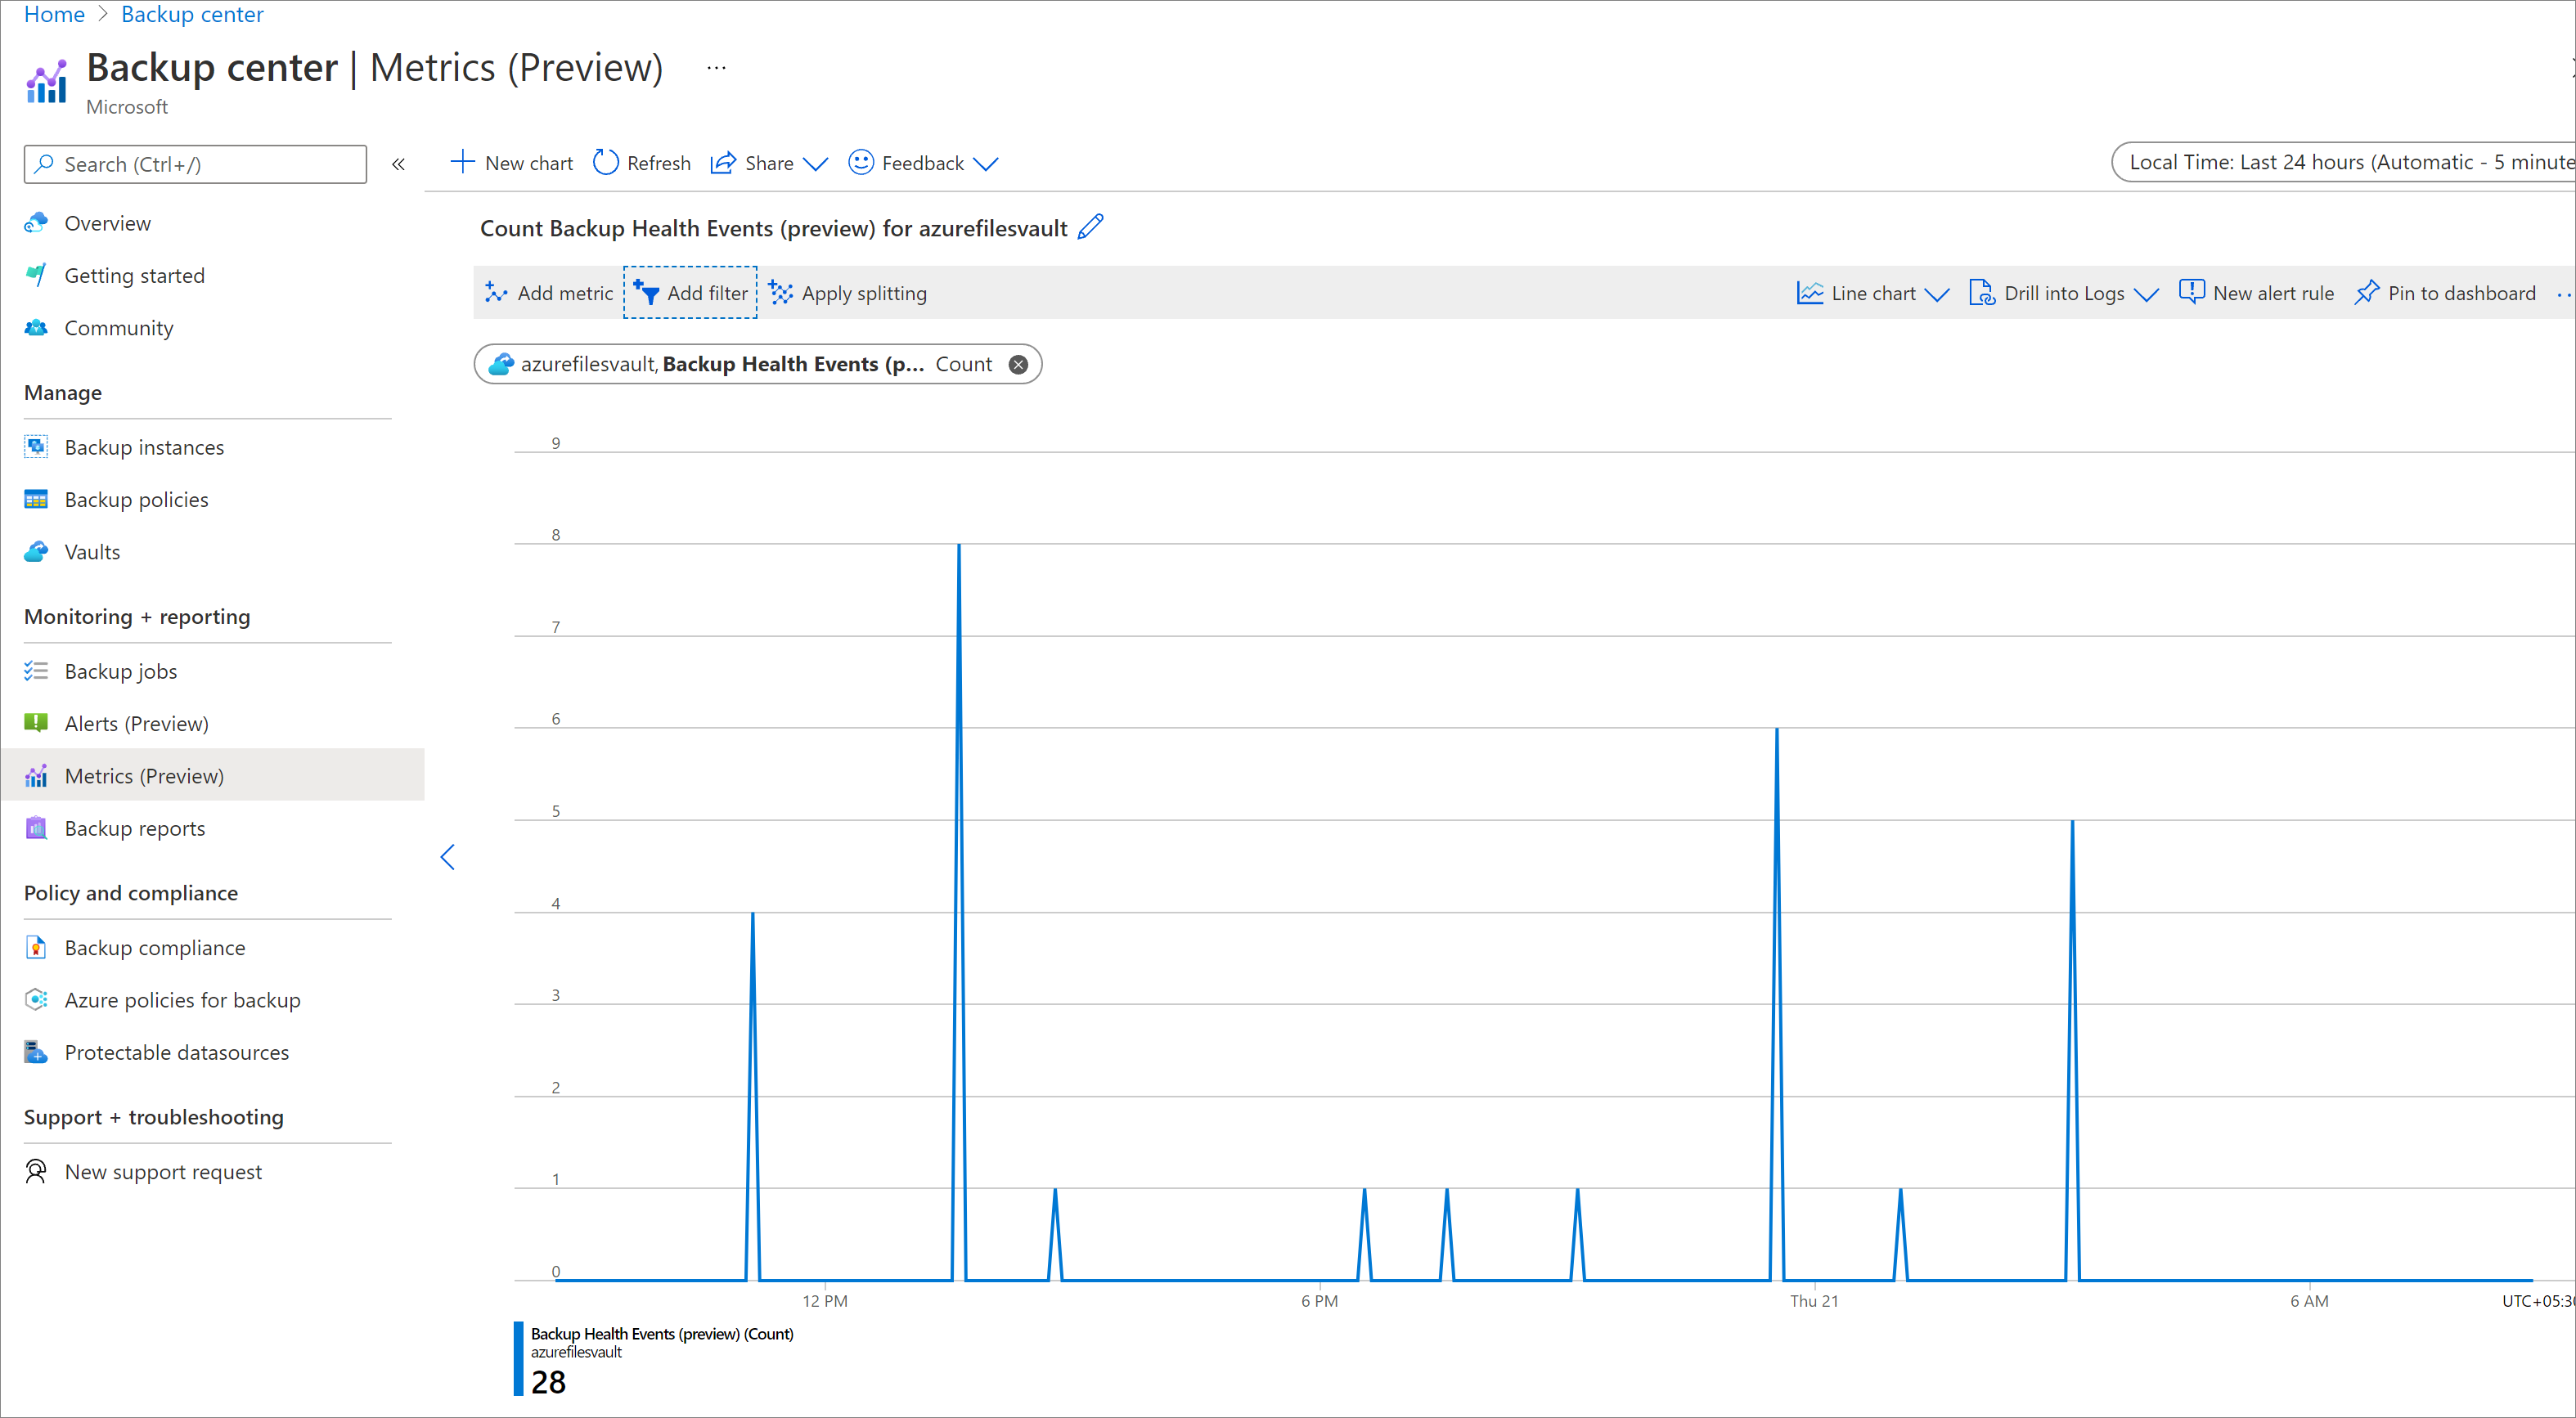
Select a metric to view Backup Health Events or Restore Health Events.
This renders a chart which shows the count of health events for the vault(s). You can adjust the time range and aggregation granularity by using the filters at the top of the screen.
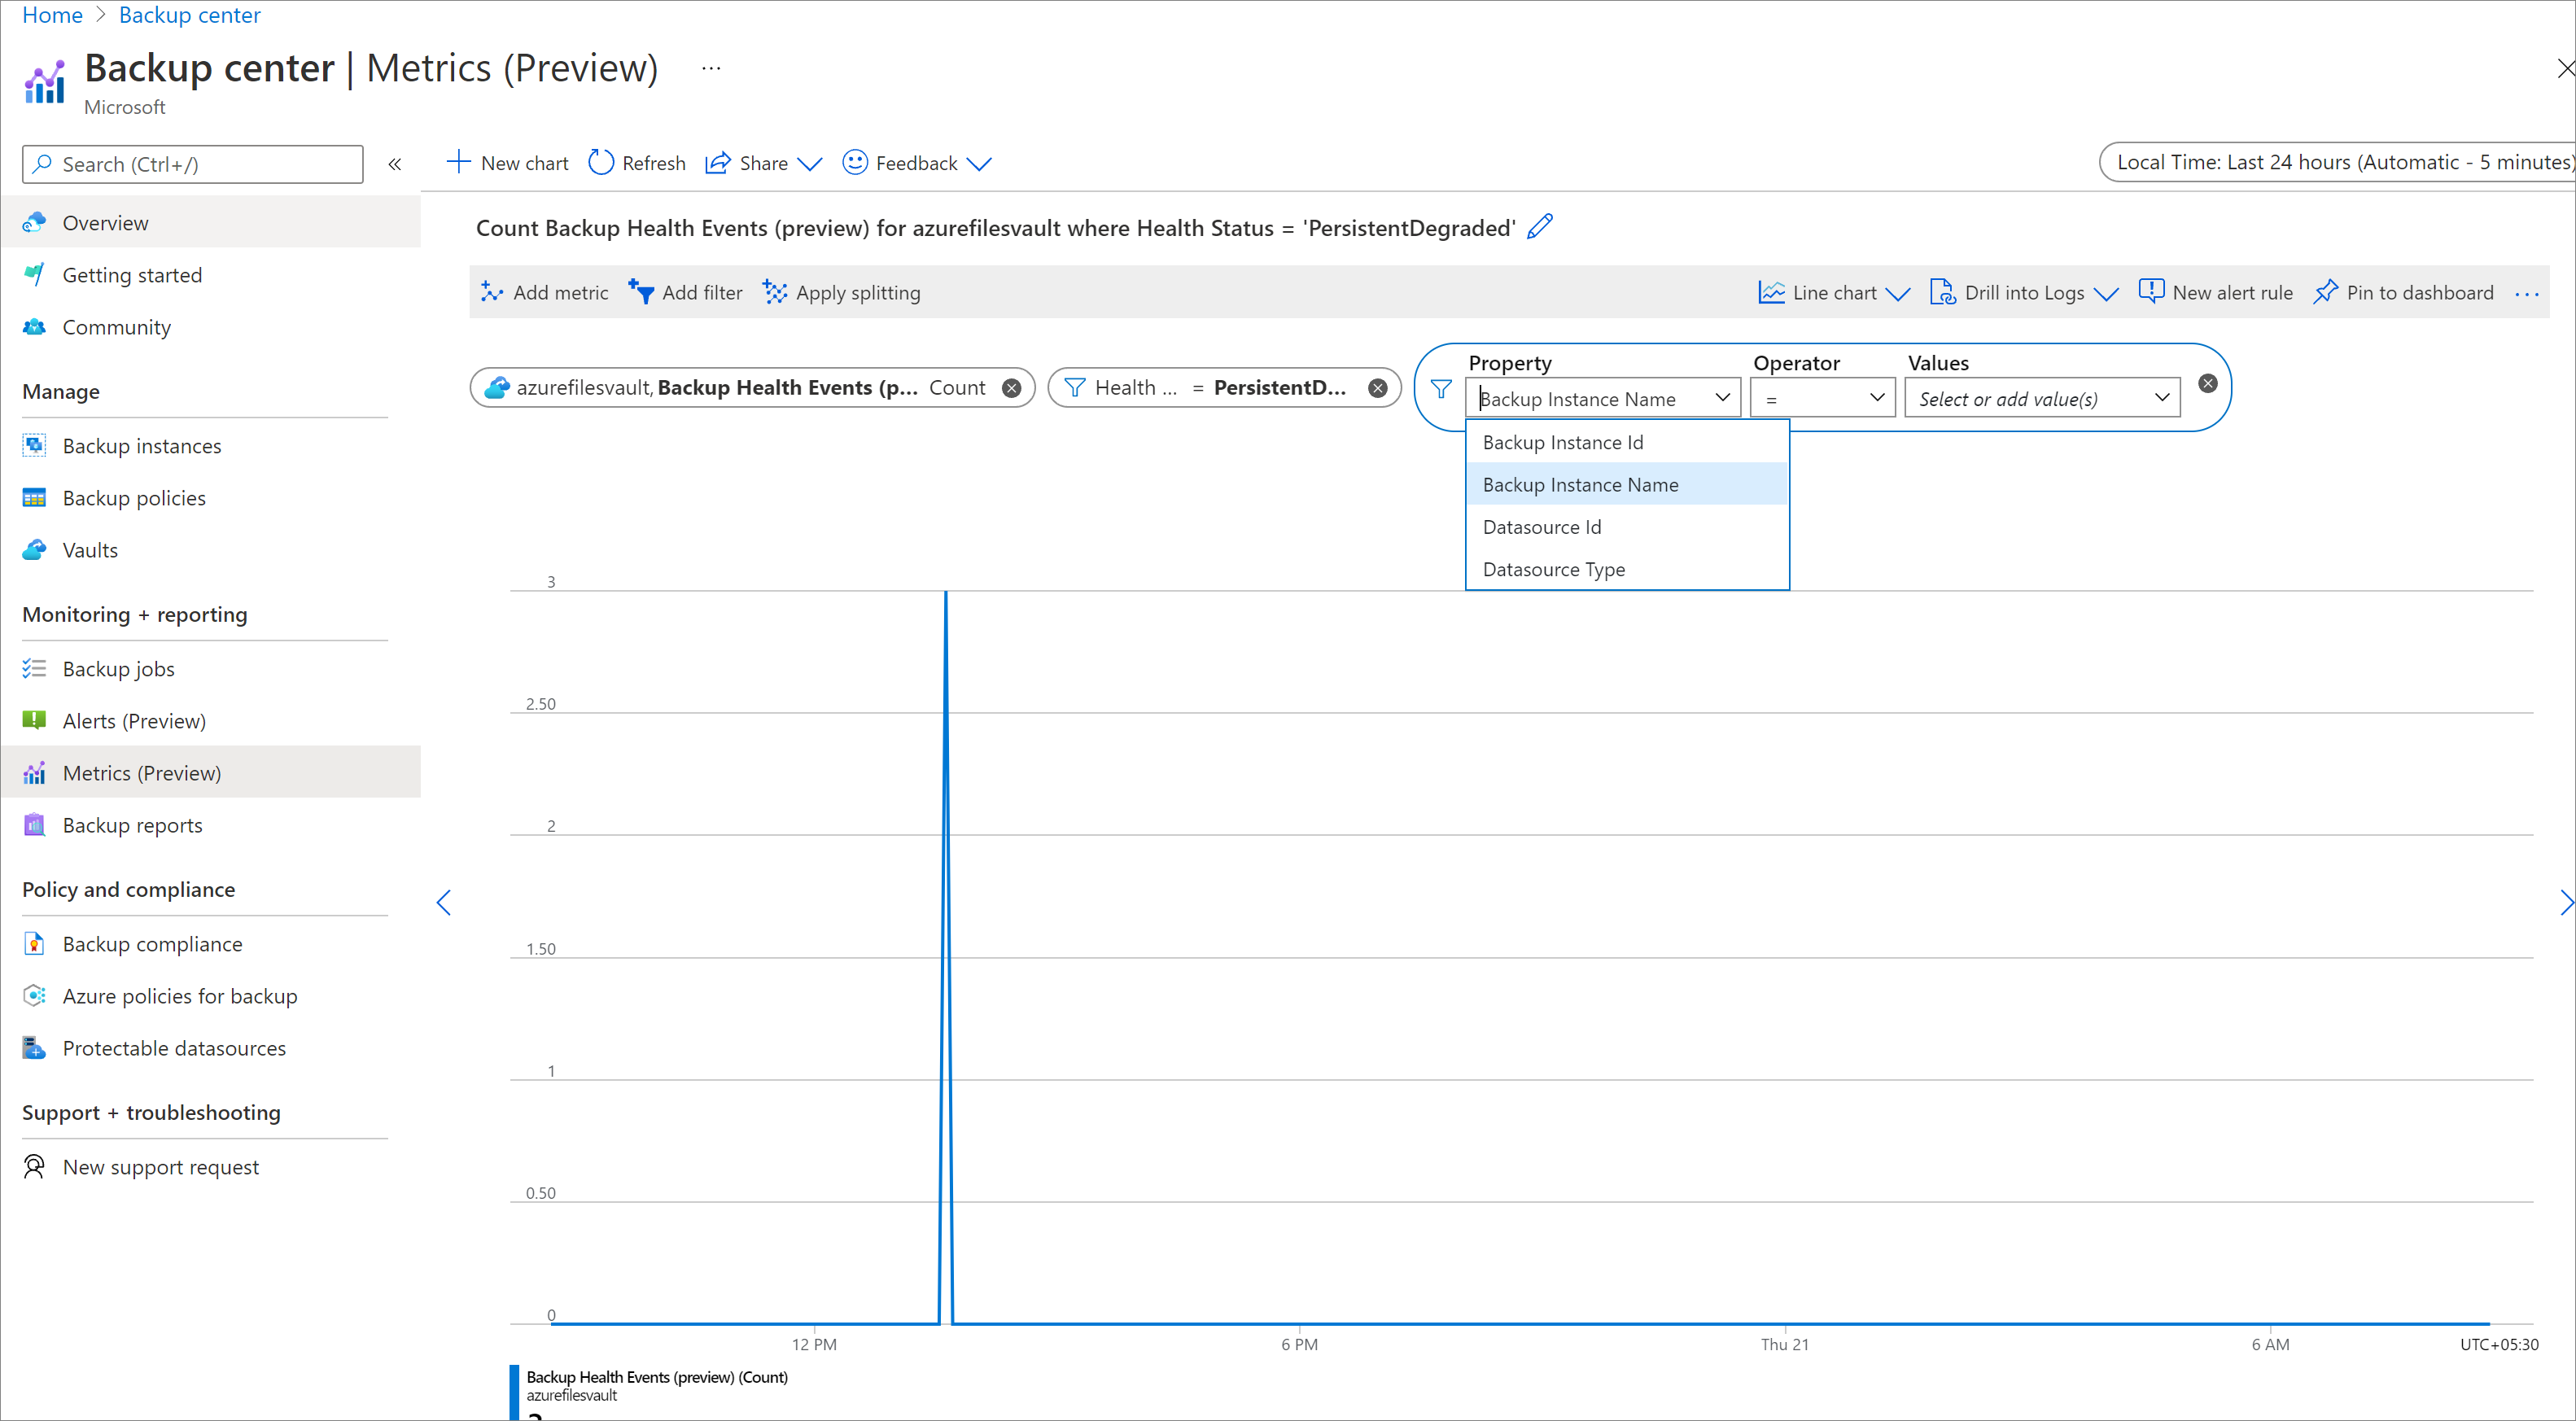
To filter metrics by different dimensions, click the Add Filter button and select the relevant dimension values.
- For example, if you wish to see health event counts only for Azure VM backups, add a filter
Datasource Type = Microsoft.Compute/virtualMachines. - To view health events for a particular datasource or backup instance within the vault, use the datasource ID/backup instance ID filters.
- To view health events only for failed backups, use a filter on HealthStatus, by selecting the values corresponding to unhealthy or degraded health state.
- For example, if you wish to see health event counts only for Azure VM backups, add a filter
Manage Alerts
To view your fired metric alerts, follow these steps:
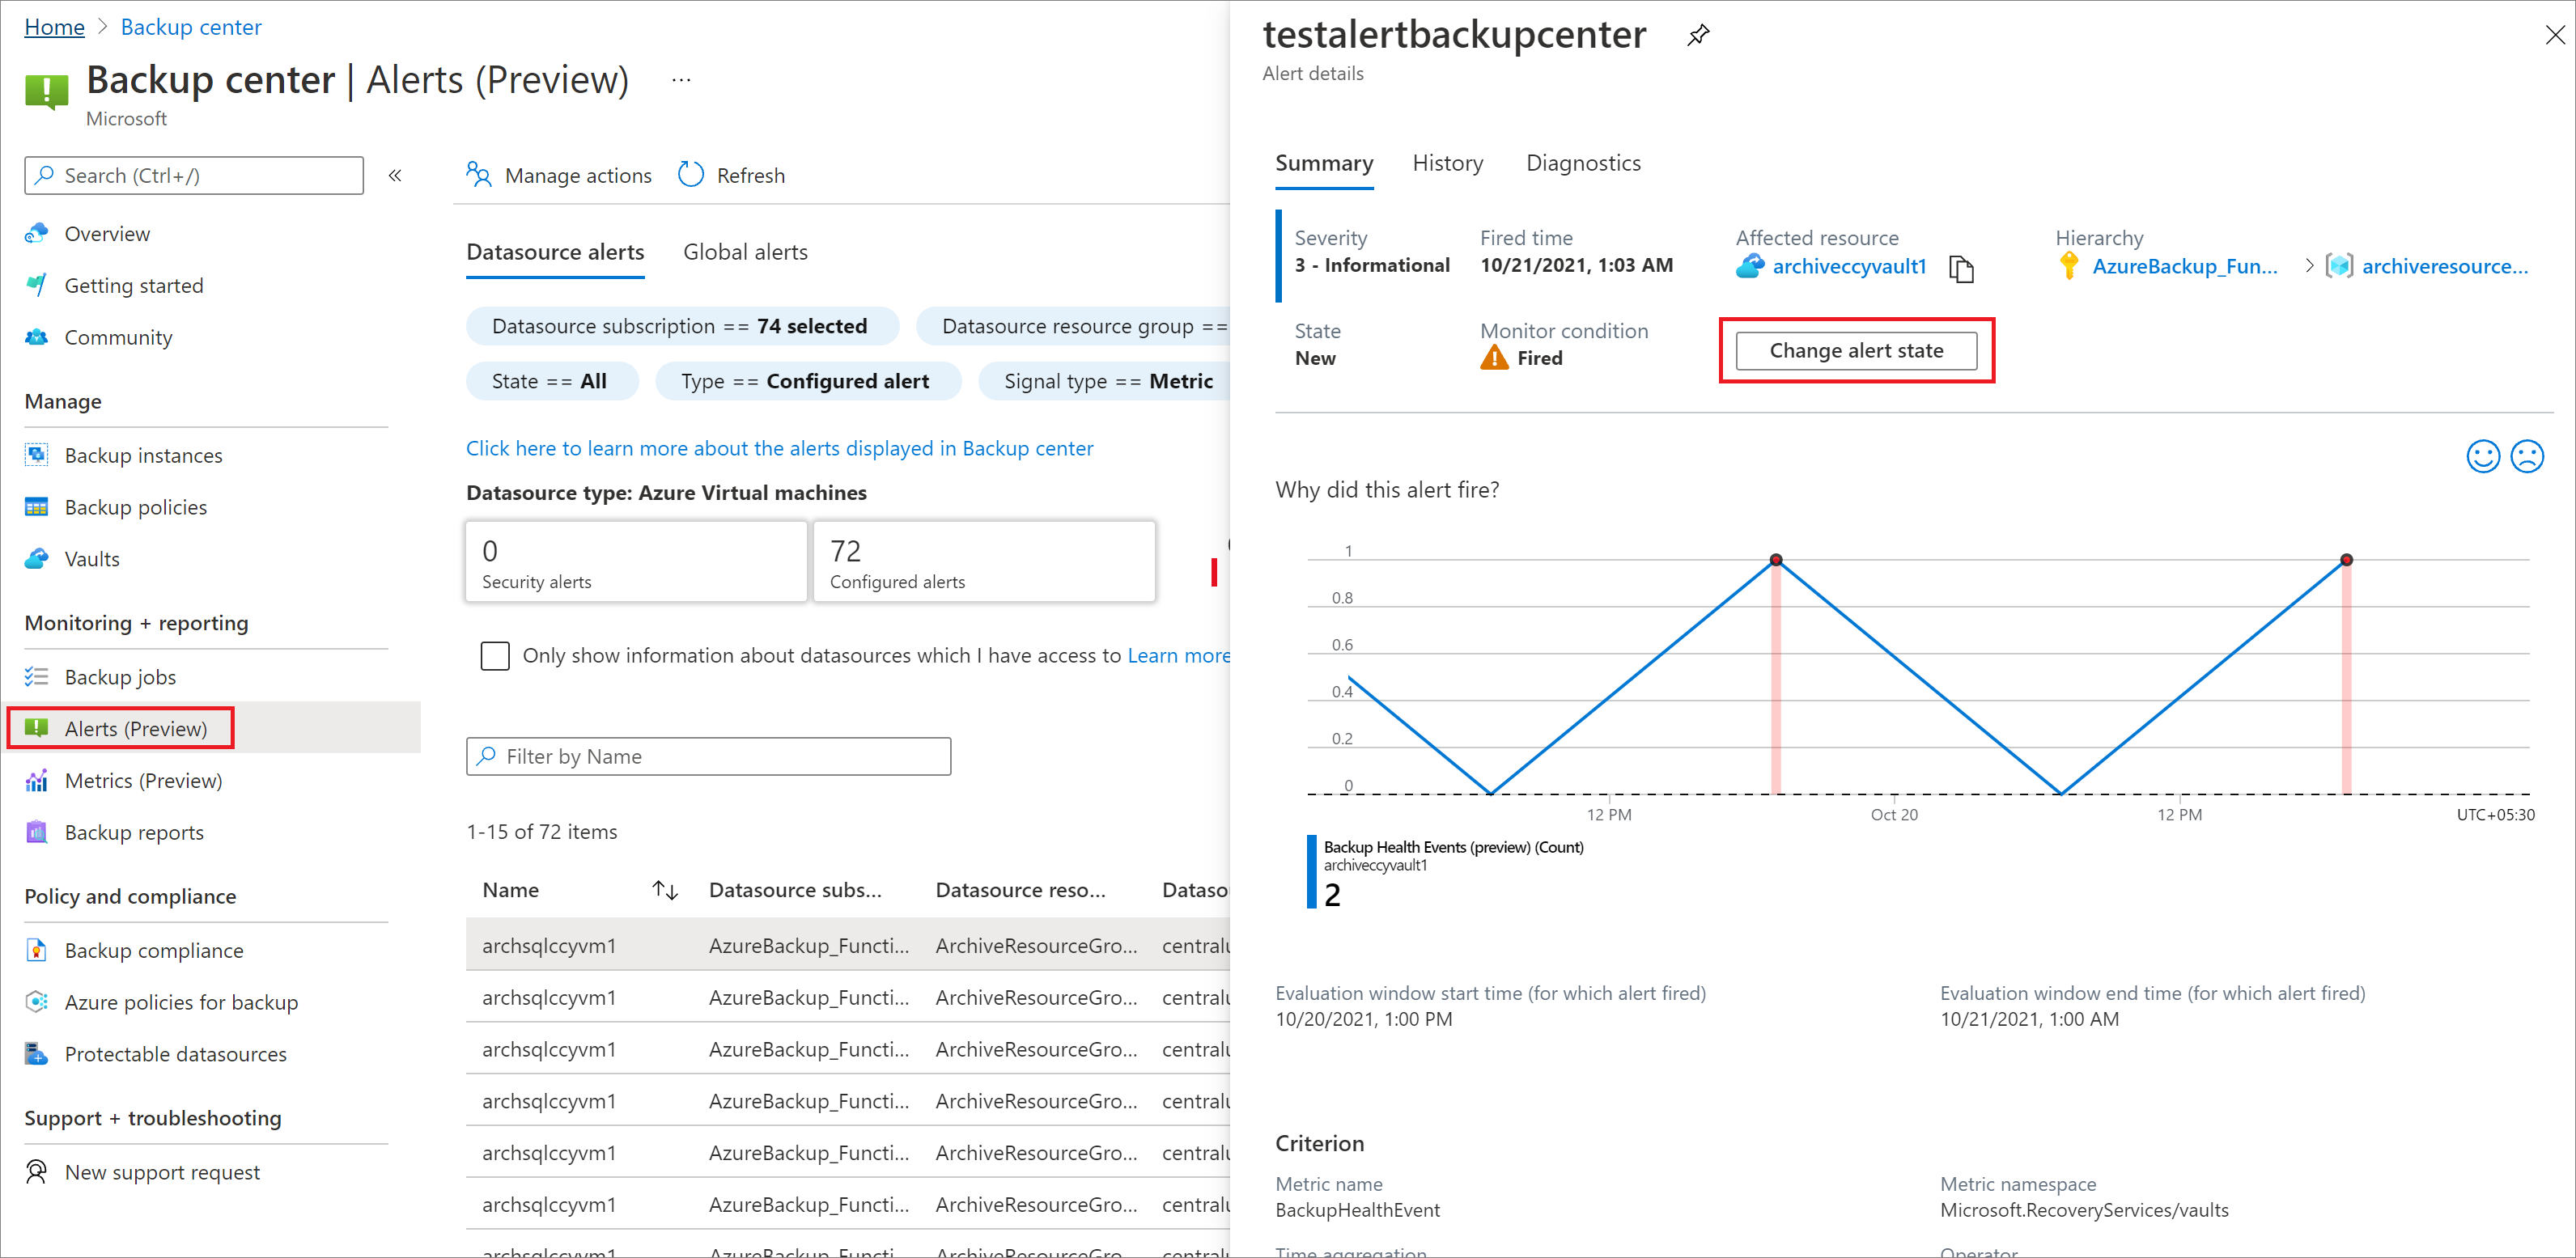
Go to Backup center > Alerts.
Filtering for Signal Type = Metric and Alert Type = Configured.
Click an alert to view more details about the alert and change its state.
Note
The alert has two fields - Monitor condition (fired/resolved) and Alert State (New/Ack/Closed).
- Alert state: You can edit this field (as shown in below screenshot).
- Monitor condition: You can't edit this field. This field is used more in scenarios where the service itself resolves the alert. For example, auto-resolution behavior in metric alerts uses the Monitor condition field to resolve an alert.
Datasource alerts and Global alerts
Based on the alert rules configuration, the fired alert appears under the Datasource Alerts section or the Global Alerts section in Backup center:
- If the alert has a datasource ID dimension associated with it, the fired alert appears under Datasource Alerts.
- If the alert doesn't have a datasource ID dimension associated with it, the fired alert appears under Global Alerts as no information that ties the alert to a specific datasource is present.
Learn more about datasource and global alerts here
Note
Currently, in case of blob restore alerts, alerts appear under datasource alerts only if you select both the dimensions - datasourceId and datasourceType while creating the alert rule. If any dimensions aren't selected, the alerts appear under global alerts.
Accessing metrics programmatically
You can use the different programmatic clients, such as PowerShell, CLI, or REST API, to access the metrics functionality. See Azure Monitor REST API documentation for more details.
Sample alert scenarios
Fire a single alert if all triggered backups for a vault were successful in last 24 hours
Alert Rule: Fire an alert if Backup Health Events < 1 in last 24 hours for:
Dimensions["HealthStatus"] != "Healthy"
Fire an alert after every failed backup job
Alert Rule: Fire an alert if Backup Health Events > 0 in last 5 minutes for:
- Dimensions["HealthStatus"]!= "Healthy"
- Dimensions["DatasourceId"]= "All current and future values"
Fire an alert if there were consecutive backup failures for the same item in last 24 hours
Alert Rule: Fire an alert if Backup Health Events > 1 in last 24 hours for:
- Dimensions["HealthStatus"]!= "Healthy"
- Dimensions["DatasourceId"]= "All current and future values"
Fire an alert if no backup job was executed for an item in last 24 hours
Alert Rule: Fire an alert if Backup Health Events < 1 in the last 24 hours for:
Dimensions["DatasourceId"]= "All current and future values"


