Set up Code Optimizations
Setting up Code Optimizations to identify and analyze CPU and memory bottlenecks in your web applications is a simple process in the Azure portal. In this guide, you learn how to:
- Connect your web app to Application Insights.
- Enable the .NET Profiler on your web app.
Connect your web app to Application Insights
Before setting up Code Optimizations for your web app, ensure that your app is connected to an Application Insights resource.
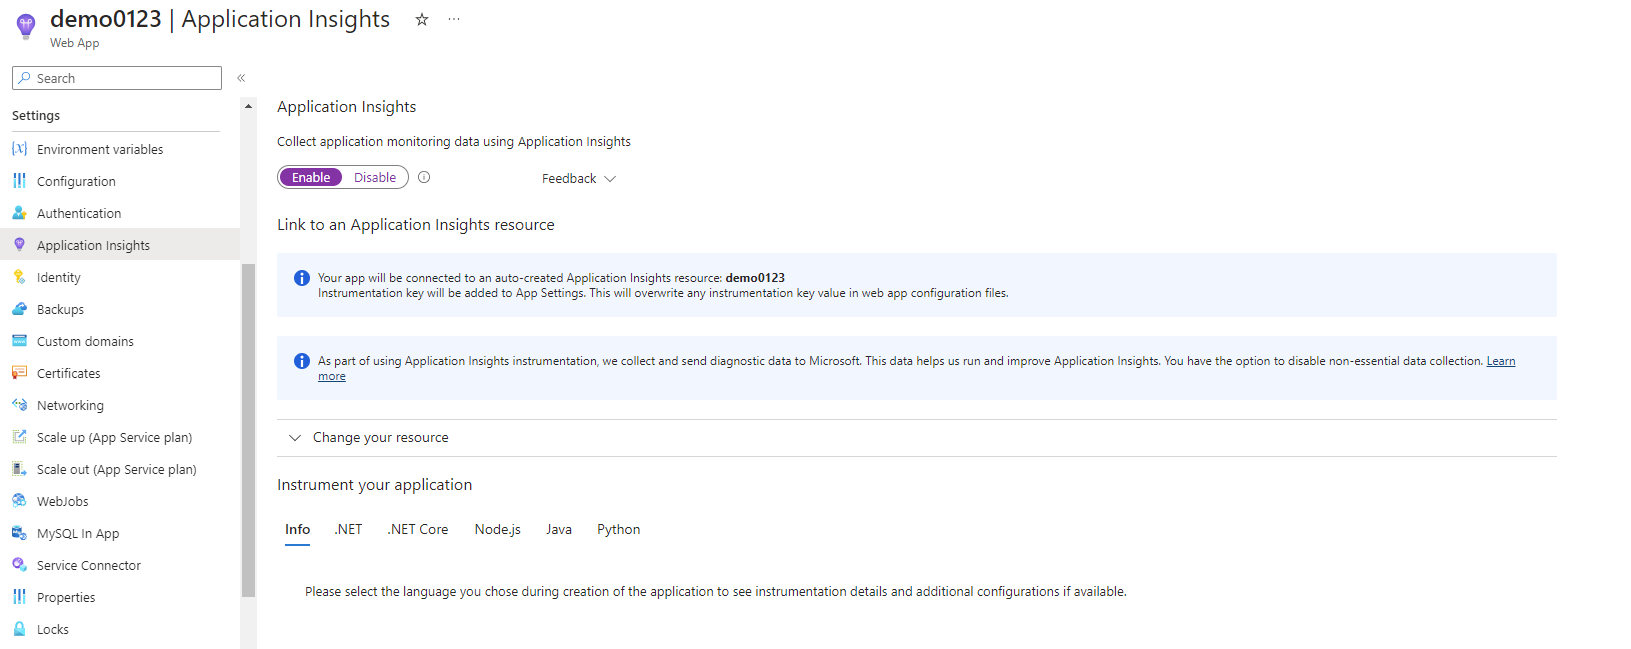
In the Azure portal, navigate to your web application.
From the left menu, select Settings > Application Insights.
In the Application Insights blade for your web application, determine the following options:
If your web app is already connected to an Application Insights resource:
A banner at the top of the blade reads: Your app is connected to Application Insights resource: {NAME-OF-RESOURCE}.

If your web app still needs to be connected to an Application Insights resource:
A banner at the top of the blade reads: Your app will be connected to an auto-created Application Insights resource: {NAME-OF-RESOURCE}.

Click Apply at the bottom of the Application Insights pane.
Enable the .NET Profiler on your web app
The .NET Profiler collects traces on your web app for Code Optimizations to analyze. In a few hours, if Code Optimization notices any performance bottlenecks in your application, you can see and review Code Optimizations insights.
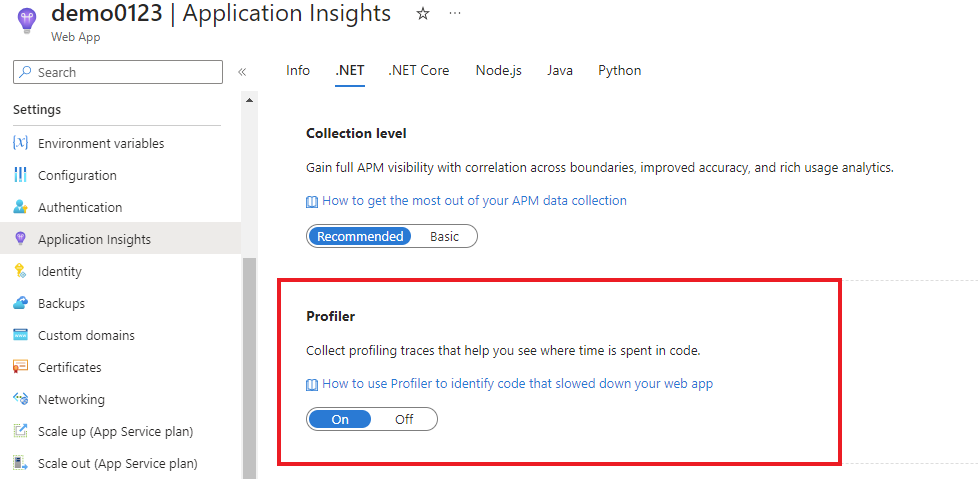
Still in the Application Insights blade, under Instrument your application, select the .NET tab.
Under Profiler, select the toggle to turn on the .NET Profiler for your web app.

Verify the .NET Profiler is collecting traces.
- Navigate to your Application Insights resource.
- From the left menu, select Investigate > Performance.
- In the Performance blade, select Profiler from the top menu.
- Review the profiler traces collected from your web app. If you don't see any traces, see the troubleshooting guide.