Note
Access to this page requires authorization. You can try signing in or changing directories.
Access to this page requires authorization. You can try changing directories.
Diagnostic settings in Azure are used to collect resource logs. An Azure resource emits resource logs and provides rich, frequent data about the operation of that resource. These logs are captured per request and are also referred to as "data plane logs". See diagnostic settings in Azure Monitor for a recommended overview of the functionality in Azure. The content of these logs varies by resource type. In Azure Cache for Redis, two options are available to log:
- Cache Metrics (that is "AllMetrics") used to log metrics from Azure Monitor
- Connection Logs logs connections to the cache for security and diagnostic purposes.
Scope of availability
| Tier | Basic, Standard, and Premium |
|---|---|
| Cache Metrics | Yes |
| Connection Logs | Yes |
Cache Metrics
Azure Cache for Redis emits many metrics such as Server Load and Connections per Second that are useful to log. Selecting the AllMetrics option allows these and other cache metrics to be logged. You can configure how long the metrics are retained. See here for an example of exporting cache metrics to a storage account.
Connection Logs
Azure Cache for Redis uses Azure diagnostic settings to log information on client connections to your cache. Logging and analyzing this diagnostic setting helps you understand who is connecting to your caches and the timestamp of those connections. The log data could be used to identify the scope of a security breach and for security auditing purposes.
Differences Between Azure Cache for Redis Tiers
Implementation of connection logs is slightly different between tiers:
- Basic, Standard, and Premium-tier caches polls client connections by IP address, including the number of connections originating from each unique IP address. These logs aren't cumulative. They represent point-in-time snapshots taken at 10-second intervals. Authentication events (successful and failed) and disconnection events aren't logged in these tiers.
The connection logs produced look similar among the tiers, but have some differences. The two formats are shown in more detail later in the article.
Important
The connection logging in the Basic, Standard, and Premium tiers polls the current client connections in the cache. The same client IP addresses appears over and over again.
Prerequisites/Limitations of Connection Logging
Basic, Standard, and Premium tiers
- Because connection logs in these tiers consist of point-in-time snapshots taken every 10 seconds, connections that are established and removed in-between 10-second intervals aren't logged.
- Authentication events aren't logged.
- All diagnostic settings may take up to 90 minutes to start flowing to your selected destination.
- Enabling connection logs can cause a small performance degradation to the cache instance.
- Only the Analytics Logs pricing plan is supported when streaming logs to Azure Log Analytics. For more information, see Azure Monitor pricing.
Note
It is always possible to use the INFO or CLIENT LIST commands to check who is connected to a cache instance on-demand.
Important
When selecting logs, you can chose either the specific Category or Category groups, which are predefined groupings of logs across Azure services. When you use Category groups, you can no longer configure the retention settings. If you need to determine retention duration for your connection logs, select the item in the Categories section instead.
Log Destinations
You can turn on diagnostic settings for Azure Cache for Redis instances and send resource logs to the following destinations:
- Log Analytics workspace - doesn't need to be in the same region as the resource being monitored.
- Storage account - must be in the same region as the cache. Premium storage accounts are not supported as a destination, however.
- Event hub - diagnostic settings can't access event hub resources when virtual networks are enabled. Enable the Allow trusted Microsoft services to bypass this firewall? setting in event hubs to grant access to your event hub resources. The event hub must be in the same region as the cache.
For more information on diagnostic requirements, see diagnostic settings.
You're charged normal data rates for storage account and event hub usage when you send diagnostic logs to either destination. You're billed under Azure Monitor not Azure Cache for Redis. When sending logs to Log Analytics, you're only charged for Log Analytics data ingestion.
For more pricing information, Azure Monitor pricing.
Enable connection logging using the Azure portal
Sign in to the Azure portal.
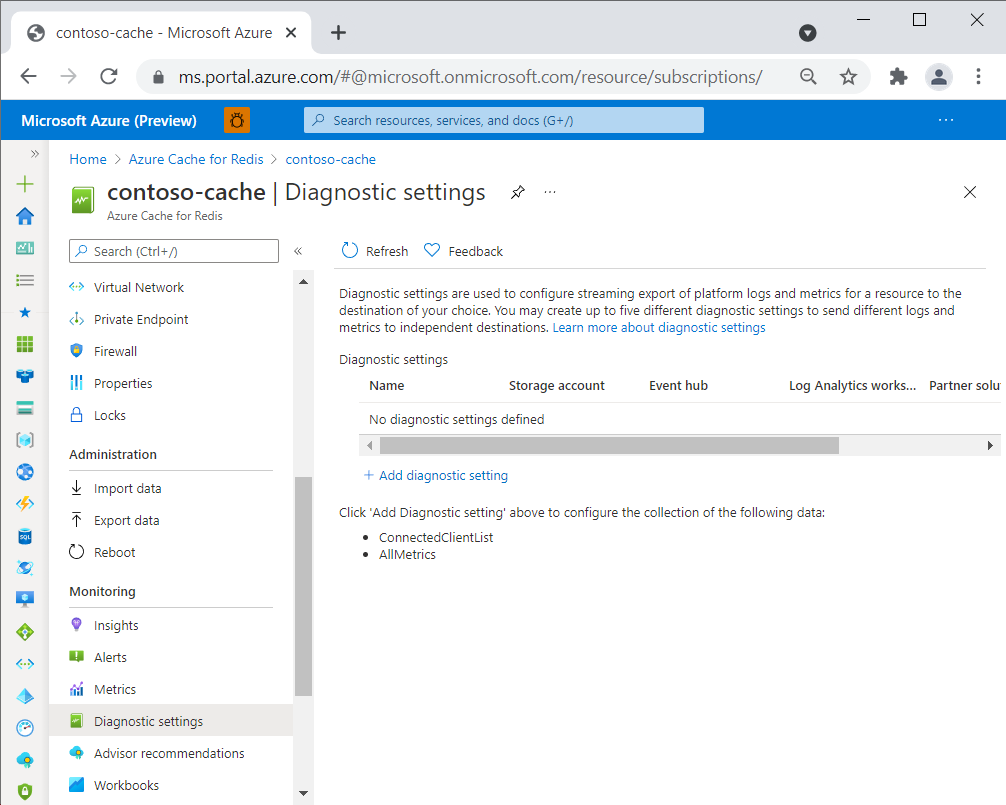
Navigate to your Azure Cache for Redis account. Open the Diagnostic settings pane under the Monitoring section on the left. Then, select Add diagnostic setting.
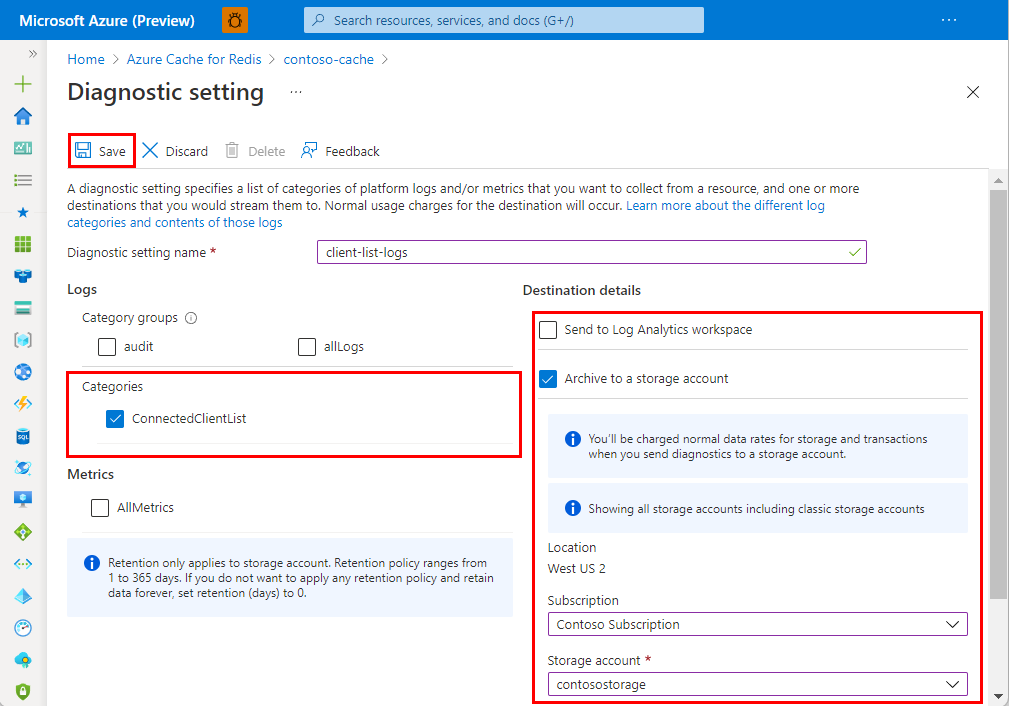
In the Diagnostic settings pane, select ConnectedClientList from Categories.
For more detail on the data logged, see below Contents of the Connection Logs.
Once you select ConnectedClientList, send your logs to your preferred destination. Select the information in the working pane.