Note
Access to this page requires authorization. You can try signing in or changing directories.
Access to this page requires authorization. You can try changing directories.
The Istio-based service mesh add-on is logically split into a control plane (istiod) and a data plane. The data plane is composed of Envoy sidecar proxies inside workload pods. Istiod manages and configures these Envoy proxies. This article presents the performance of both the control and data plane for revision asm-1-19, including resource consumption, sidecar capacity, and latency overhead. Additionally, it provides suggestions for addressing potential strain on resources during periods of heavy load. This article also covers how to customize scaling for the control plane and gateways.
Control plane performance
Istiod’s CPU and memory requirements correlate with the rate of deployment and configuration changes and the number of proxies connected. The scenarios tested were:
- Pod churn: examines the impact of pod churning on
istiod. To reduce variables, only one service is used for all sidecars. - Multiple services: examines the impact of multiple services on the maximum sidecars Istiod can manage (sidecar capacity), where each service has
Nsidecars, totaling the overall maximum.
Test specifications
- One
istiodinstance with default settings - Horizontal pod autoscaling disabled
- Node SKU: Standard D16 v3 (16 vCPU, 64-GB memory)
- Kubernetes version: 1.28.5
- Istio revision: asm-1-19
Pod churn
The ClusterLoader2 framework was used to determine the maximum number of sidecars Istiod can manage when there's sidecar churning. The churn percent is defined as the percent of sidecars churned down/up during the test. For example, 50% churn for 10,000 sidecars would mean that 5,000 sidecars were churned down, then 5,000 sidecars were churned up. The churn percents tested were determined from the typical churn percentage during deployment rollouts (maxUnavailable). The churn rate was calculated by determining the total number of sidecars churned (up and down) over the actual time taken to complete the churning process.
Sidecar capacity and Istiod CPU and memory
Azure CNI overlay
| Churn (%) | Churn Rate (sidecars/sec) | Sidecar Capacity | Istiod Memory (GB) | Istiod CPU |
|---|---|---|---|---|
| 0 | -- | 25000 | 32.1 | 15 |
| 25 | 31.2 | 15000 | 22.2 | 15 |
| 50 | 31.2 | 15000 | 25.4 | 15 |
Azure CNI overlay with Cilium
| Churn (%) | Churn Rate (sidecars/sec) | Sidecar Capacity | Istiod Memory (GB) | Istiod CPU |
|---|---|---|---|---|
| 0 | -- | 30000 | 41.2 | 15 |
| 25 | 41.7 | 25000 | 36.1 | 16 |
| 50 | 37.9 | 25000 | 42.7 | 16 |
Multiple services
The ClusterLoader2 framework was used to determine the maximum number of sidecars istiod can manage with 1,000 services. The results can be compared to the 0% churn test (one service) in the pod churn scenario. Each service had N sidecars contributing to the overall maximum sidecar count. The API Server resource usage was observed to determine if there was any significant stress from the add-on.
Sidecar capacity
| Azure CNI Overlay | Azure CNI Overlay with Cilium |
|---|---|
| 20000 | 20000 |
CPU and memory
| Resource | Azure CNI Overlay | Azure CNI Overlay with Cilium |
|---|---|---|
| API Server Memory (GB) | 38.9 | 9.7 |
| API Server CPU | 6.1 | 4.7 |
| Istiod Memory (GB) | 40.4 | 42.6 |
| Istiod CPU | 15 | 16 |
Data plane performance
Various factors impact sidecar performance such as request size, number of proxy worker threads, and number of client connections. Additionally, any request flowing through the mesh traverses the client-side proxy and then the server-side proxy. Therefore, latency and resource consumption are measured to determine the data plane performance.
Fortio was used to create the load. The test was conducted with the Istio benchmark repository that was modified for use with the add-on.
Test specifications
- Node SKU: Standard D16 v5 (16 vCPU, 64-GB memory)
- Kubernetes version: 1.28.5
- Two proxy workers
- 1-KB payload
- 1,000 Queries per second (QPS) at varying client connections
http/1.1protocol and mutual Transport Layer Security (TLS) enabled- 26 data points collected
CPU and memory
The memory and CPU usage for both the client and server proxy for 16 client connections and 1,000 QPS across all network plugin scenarios is roughly 0.4 vCPU and 72 MB.
Latency
The sidecar Envoy proxy collects raw telemetry data after responding to a client, which doesn't directly affect the request's total processing time. However, this process delays the start of handling the next request, contributing to queue wait times and influencing average and tail latencies. Depending on the traffic pattern, the actual tail latency varies.
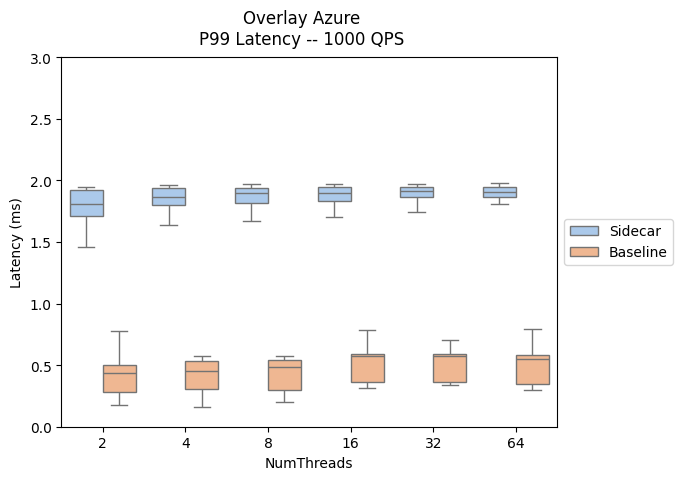
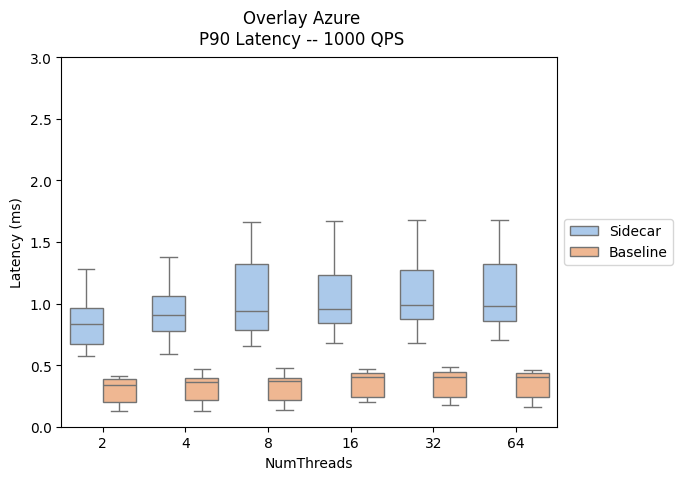
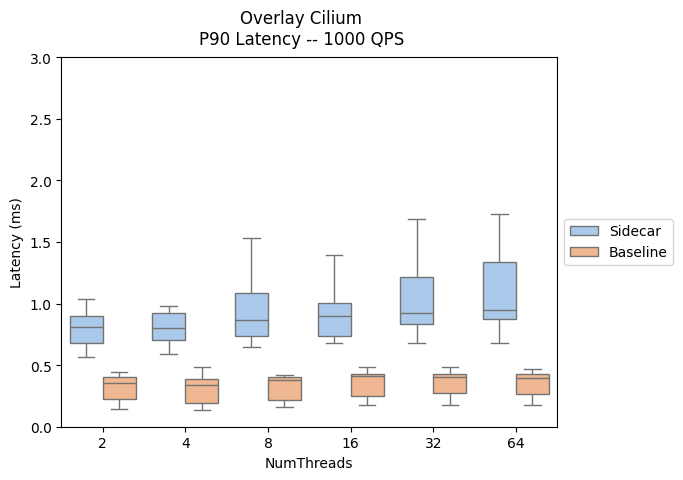
The following results evaluate the impact of adding sidecar proxies to the data path, showcasing the P90 and P99 latency.
- Sidecar traffic path: client --> client-sidecar --> server-sidecar --> server
- Baseline traffic path: client --> server
A comparison of data plane latency performance across Istio add-on and AKS versions can be found here.
| Azure CNI Overlay | Azure CNI Overlay with Cilium |
|---|---|
 |
 |
 |
 |
Scaling
Horizontal pod autoscaling customization
Horizontal pod autoscaling (HPA) is enabled for the istiod and ingress gateway pods. The default configurations for istiod and the gateways are:
- Min Replicas: 2
- Max Replicas: 5
- CPU Utilization: 80%
Note
To prevent conflicts with the PodDisruptionBudget, the add-on does not allow setting the minReplicas below the initial default of 2.
The following are the istiod and ingress gateway HPA resources:
NAMESPACE           NAME                                         REFERENCE
aks-istio-ingress   aks-istio-ingressgateway-external-asm-1-19   Deployment/aks-istio-ingressgateway-external-asm-1-19

aks-istio-ingress   aks-istio-ingressgateway-internal-asm-1-19   Deployment/aks-istio-ingressgateway-internal-asm-1-19

aks-istio-system    istiod-asm-1-19                              Deployment/istiod-asm-1-19
The HPA configuration can be modified through patches and direct edits. Example:
kubectl patch hpa aks-istio-ingressgateway-external-asm-1-19 -n aks-istio-ingress --type merge --patch '{"spec": {"minReplicas": 3, "maxReplicas": 6}}'
Note
See the Istio add-on upgrade documentation for details on how HPA settings are applied across both revisions during a canary upgrade.
Service entry
Istio's ServiceEntry custom resource definition enables adding other services into the Istio’s internal service registry. A ServiceEntry allows services already in the mesh to route or access the services specified. However, the configuration of multiple ServiceEntries with the resolution field set to DNS can cause a heavy load on Domain Name System (DNS) servers. The following suggestions can help reduce the load:
- Switch to
resolution: NONEto avoid proxy DNS lookups entirely. Suitable for most use cases. - Increase TTL (Time To Live) if you control the domains being resolved.
- Limit the ServiceEntry scope with
exportTo.